
Page 198 - Haematologica - Vol. 105 n. 6 - June 2020
P. 198
L.K. Nielsen et al.
could have been overestimated and toxicities underesti- mated. We performed additional analyses to exclude such a potential bias. Although it was not required, a question- naire was available after treatment discontinuation (“off protocol” questionnaires) from 90 patients (53 MPT-T and 37 MPR-R), of which 84 could be matched with question- naires from patients on protocol with comparable age, WHO, disease status, treatment arm and period. The glob- al QoL for patients on protocol was comparable to patients off protocol (mean score 59.9 vs. 66.3 points, respectively, P=0.043; Online Supplementary Table S5). Secondly, in general, the HRQoL course did not differ between patients who discontinued therapy early (≤T2, e.g. during induction) and those who discontinued therapy late or never (>T2, e.g. from start maintenance; Online Supplementary Table S6 and Online Supplementary Figure S6). Lastly, global QoL over time did not differ between patients discontinuing treatment due to investigator- reported peripheral neuropathy and patients continuing treatment until 12 months of maintenance therapy (P<0.001; Online Supplementary Table S7 and Online Supplementary Figure S6). These analyses support the absence of bias in our analyses.
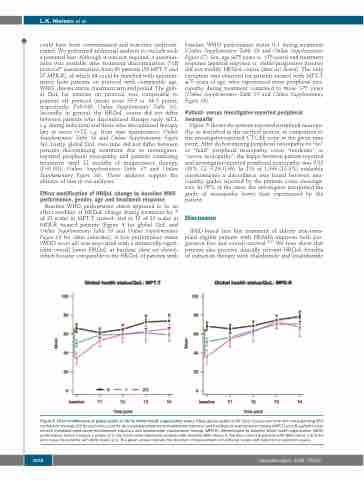
Effect modification of HRQoL change by baseline WHO performance, gender, age and treatment response
Baseline WHO performance status appeared to be an effect modifier of HRQoL change during treatment for 7 of 21 scales in MPT-T treated- and in 12 of 21 scales in MPR-R treated patients (Figure 4 for global QoL and Online Supplementary Table S8 and Online Supplementary Figure S8 for other subscales). A low performance status (WHO score ≥2) was associated with a statistically signif- icant overall lower HRQoL at baseline (data not shown), which became comparable to the HRQoL of patients with
baseline WHO performance status 0-1 during treatment (Online Supplementary Table S8 and Online Supplementary Figure S7). Sex, age (≤75 years vs. >75 years) and treatment response (≥partial response vs. stable/progressive disease) did not modify HRQoL course (data not shown). The only exception was observed for patients treated with MPT-T ≤75 years of age, who experienced more peripheral neu- ropathy during treatment compared to those >75 years (Online Supplementary Table S9 and Online Supplementary Figure S8).
Patient- versus investigator-reported peripheral neuropathy
Figure 5 shows the patient-reported peripheral neuropa- thy, as described in the method section, in comparison to the investigator-reported CTCAE score at the given time point. After dichotomizing peripheral neuropathy to “no” or “mild” peripheral neuropathy versus “moderate” or “severe neuropathy”, the kappa between patient-reported and investigator-reported peripheral neuropathy was 0.33 (95% CI: 0.29–0.36). In 213 of 1,599 (13.3%) evaluable questionnaires a discordance was found between neu- ropathy grades reported by the patients versus investiga- tors. In 76% of the cases, the investigator interpreted the grade of neuropathy lower than experienced by the patient.
Discussion
IMiD-based first line treatment of elderly non-trans- plant eligible patients with NDMM improves both pro- gression free and overall survival.25-28 We here show that patients also perceive clinically relevant HRQoL benefits of induction therapy with thalidomide and lenalidomide
Figure 4. Effect modification of global quality of life by World Health Organisation status. Mean global quality of life (QoL) course over time with corresponding 95% confidence intervals (CI) for each time point for (A) melphalan-prednisone-thalidomide induction and thalidomide maintenance therapy (MPT-T) and (B) patients treat- ed with melphalan-prednisone-lenalidomide induction and lenalidomide maintenance therapy (MPR-R), differentiated by baseline World health organisation (WHO) performance status 0 versus 1 versus 2/3. The black curve represents patients with baseline WHO status 0, the blue curve the patients with WHO status 1 and the pink curve the patients with WHO status 2/3. The green arrows indicate the direction of improvement in functional scales and reduction in symptom scales.
1656
haematologica | 2020; 105(6)
