
Page 194 - Haematologica - Vol. 105 n. 6 - June 2020
P. 194
L.K. Nielsen et al.
(MPR-R). Maintenance treatment was given until progression, intolerable side effects or other conditions that required treat- ment discontinuation. The study protocol was approved by the Ethics Committee, and written informed consent was obtained from all participants. The study was registered at www.trialregis- ter.nl as NTR1630.
Health-related quality of life assessments
Participation in the HRQoL reporting was optional. Questionnaires were given to the patients at baseline (T0), after induction cycle 3 (T1) and cycle 9 (T2), and after six (T3) and 12 (T4) months of maintenance therapy.
For HRQoL assessment, two EORTC QoL questionnaires were used; the QLQ-C30 and the Myeloma specific QLQ- MY20.18,19 The QLQ-C30 contains five functional scales, nine symptom scales and one global QoL scale.20,21 The QLQ-MY20 contains two functional and two symptom scales. For the evalu- ation of peripheral neuropathy, question 13 of the QLQ-MY20 “Did you have tingling hands or feet?” was used. The EORTC man- ual21 was used to calculate all HRQoL scales. A detailed descrip- tion of the questionnaires and neuropathy scale, data collection and assignment of the questionnaires to T0-T4 is found in the Online Supplementary Material and Methods.
Statistical analyses
Change in HRQoL over time was assessed by linear mixed models, both “within arms” and “between arms”, from T0 to T4, as well as from T2 to T4 for patients who had at least three months of maintenance therapy. A P-value <0.005 was consid- ered statistically significant as multiple subscales were tested. Model estimates were used for post hoc comparisons of changes from baseline.21 A change in mean HRQoL score was defined as clinically meaningful if it was above the minimal important dif- ference (MID) threshold using distribution-based MID calculat- ed for both QLQ-C30 and MY20 subscales.22 MID between arms was defined as >5 points difference at a specific time point.22 For QLQ-C30 subscales, an additional anchor-based method by Cocks was used, assessing whether HRQoL changes and differ- ences were of small, medium or large effect.23,24 Details are described in the Online Supplementary Material and Methods.
To check for effect modification by the World Health Organisation (WHO) performance, sex, age and treatment response, linear mixed models included fixed effects for time, WHO, sex, age, treatment response and their two-way interac- tion and a random slope for subject.
HRQoL questionnaires were not systematically collected from patients who discontinued treatment, which might introduce a bias when comparing HRQoL. Therefore, we investigated the impact of missing data due to treatment discontinuation on changes in HRQoL over time. We compared HRQoL of i) patients on and off protocol matched by timing, ii) patients who discontinued therapy before or after start of maintenance, and iii) patients who discontinued therapy because of peripheral neuropathy versus patients still on protocol until 12 months maintenance therapy. For a detailed description, see the Online Supplementary Appendix Materials and Methods.
For statistical analysis, SPSS version 22.0 was used.
Results
Ninety-four percent (596) of the 637 patients included in the HOVON-87/NSMG18 trial gave informed consent for participation in the HRQoL study. Only patients who filled out a baseline questionnaire were included in the
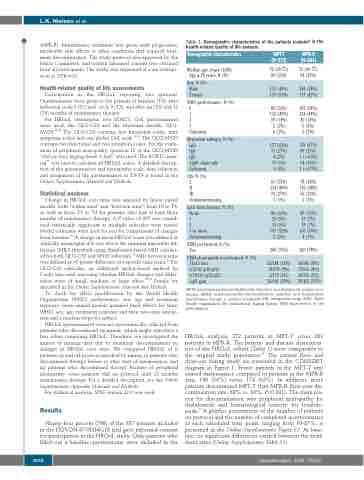
Table 1. Demographic characteristics of the patients included in the health-related quality of life analysis.
Demographic characteristics
Median age, years (IQR) Age ≥ 76 years, N (%)
Sex, N (%) Male Female
WHO performance, N (%) 0
1
2
3 Unknown
M-protein subtype, N (%) IgG
IgA
IgD
Light chain only Unknown
ISS, N (%) I
II
III Unknown/missing
Lytic bone lesions, N (%) None
1
2
3 or more
Unknown/missing
FISH performed, N (%) Yes
FISH abnormality if performed, N (%) 17p13 loss
t(4;14)(p16;q32)
t(14;16)(q32;q23)
1q21 gain
MPT-T (N=272)
72 (69-77) 90 (33%)
133 (49%)
139 (51%)
89 (33%) 132 (49%) 39 (14%) 5 (2%) 6 (2%)
177 (65%) 73 (27%) 4 (2%) 17 (6%) 0 (0%)
61 (23%) 134 (49%) 74 (27%) 3 (1%)
86 (32%) 25 (9%) 15 (6%) 141 (52%) 5 (2%)
206 (76%)
23/188 (12%) 18/199 (9%) 2/170 (1%) 56/146 (38%)
MPR-R (N=281)
73 (69-77) 98 (35%)
164 (58%)
117 (42%)
107 (38%) 124 (44%) 40 (14%) 5 (2%) 5 (2%)
176 (63%) 69 (25%) 1 (<0.5%) 34 (12%) 1 (<0.5%)
78 (28%) 136 (48%) 65 (23%) 2 (1%)
89 (32%) 19 (7%) 19 (7%) 150 (53%) 4 (1%)
220 (78%)
16/196 (8%) 17/216 (8%) 10/192 (5%) 58/165 (35%)
MPT-T: melphalan-prednisone-thalidomide induction and thalidomide maintenance therapy; MPR-R: melphalan-prednisone-lenalidomide induction and lenalidomide maintenance therapy; n: number of patients; IQR: interquartile range, WHO: World Health Organisation; ISS: International Staging System; FISH: fluorescence in situ hybridization.
HRQoL analysis; 272 patients in MPT-T versus 281 patients in MPR-R. The patient- and disease characteris- tics of the HRQoL cohort (Table 1) were comparable to the original study population.17 The patient flow and drop-out during study are presented in the CONSORT diagram in Figure 1. Fewer patients in the MPT-T arm started maintenance compared to patients in the MPR-R arm, 146 (54%) versus 174 (62%). In addition, more patients discontinued MPT-T than MPR-R (first year dis- continuation rate; 68% vs. 30%; P<0.001). The main rea- son for discontinuation was peripheral neuropathy for thalidomide and hematological toxicity for lenalido- mide.17 A graphic presentation of the number of patients on protocol and the number of completed questionnaires at each scheduled time point, ranging from 69-87%, is presented in the Online Supplementary Figure S1. At base- line, no significant differences existed between the treat- ment arms (Online Supplementary Table S1).
1652
haematologica | 2020; 105(6)
