
Page 278 - Haematologica May 2020
P. 278
A. Delluc et al.
ies OR outcome studies OR decision support techniques), (venous thromboembolism recurrence) AND cancer AND (deci- sion tree OR clinical prediction rule OR clinical prediction score OR clinical decision rule OR management studies OR outcome studies OR decision support techniques). The search was limited to English and French language studies. Literature search was restricted to 1st June 2012 to 15th December 2018, since the Ottawa score was published online in June 2012. To ensure a comprehensive literature search, we examined reference lists from retrieved articles and reference literature (guidelines and systematic reviews), and contacted experts in the management of cancer-associated VTE for possible missing studies. Eligible studies were those validating either the original or the modified Ottawa scores. If key data were missing, study authors were contacted to request the relevant data. Two investigators inde- pendently evaluated studies for possible inclusion (AD and SM). They independently assessed study quality and extracted the data on study design and patient characteristics. Disagreements about extracted data were resolved by consensus or by discus- sion with a third reviewer (MC).
Quality assessment and data extraction
Methodological quality of included studies was assessed inde- pendently by two observers (AD and SM) using the Hayden qual- ity assessment tool specifically developed for systematic reviews of prognosis studies.10 This tool assesses six potential biases. 1) Is the population of interest represented in the study sample? 2) Are there cases of Loss to Follow Up that are not associated with key characteristics? 3) Is there adequate measurement of the prognos- tic factors? 4) Is there adequate measurement of the outcome of
interest? 5) Are important confounders accounted for? 6) Has the appropriate statistical analysis been conducted? Regarding the study population criterion, we considered as representative cohorts those that included consecutive patients with document- ed cancer-associated VTE with at least six months of follow up.
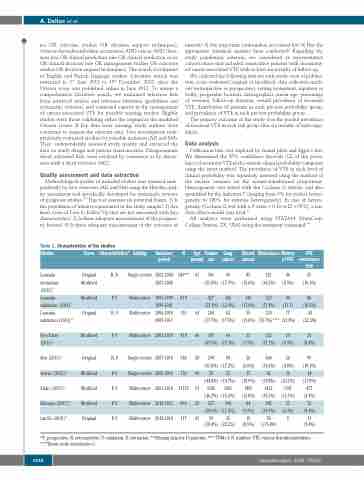
We collected the following data for each study: year of publica- tion, score evaluated (original or modified), data collection meth- ods (retrospective or prospective), setting (outpatient, inpatient or both), geographic location, demographics (mean age, percentage of women), follow-up duration, overall prevalence of recurrent VTE, distribution of patients in each pre-test probability group, and prevalence of VTE in each pre-test probability group.
The primary outcome of the study was the pooled prevalence of recurrent VTE in each risk group after six months of anticoagu- lation.
Data analysis
Publication bias was explored by funnel plots and Egger’s test. We determined the 95% confidence intervals (CI) of the preva- lence of recurrent VTE in the various clinical probability categories using the exact method. The prevalence of VTE in each level of clinical probability was separately assessed using the method of the inverse variance on the arcsine-transformed proportions. Heterogeneity was tested with the Cochran Q statistic and also quantified by the indicator I2 (ranging from 0% for perfect homo- geneity to 100% for extreme heterogeneity). In case of hetero- geneity (Cochran Q test with a P-value < 0.10 or I2 > 50%), a ran- dom effects model was used.11
All analyses were performed using STATA14 (StataCorp, College Station, TX, USA) using the metaprop command.12
Age Female Lung Breast Metastases History VTE (mean) sex cancer cancer of VTE recurrence
rate
543** 63 303 96 85 321 46 55
Table 1. Characteristics of the studies.
Studies
Louzada derivation (2012)9
Louzada validation (2012)9 Louzada validation (2012)14
Den Exter
(2013)17
Ahn (2013)19 Astruc (2016)13 Alatri (2017)16 Khorana (2017)18 van Es (2018)15
Score Characteristics* Setting
Inclusion N period
Original R,D Modified
Single-center
Multicenter
Multicenter
Multicenter
Single-center Single-center Multicenter Multicenter Multicenter
2002-2004 2007-2008
1995-1999
1999-2001 2006-2010 2009-2011
2001-2010
2007-2010 2000-2010 2001-2016 2010-2013 2012-2014
(55.8%) (17.7%)
427 106
(52.1%) (12.9%) 204 62 (57.7%) (17.5%)
197 64
(47.0%) (15.3%)
294 94
(53.8%) (17.2%)
70 23
(44.8%) (14.7%)
5145 1691
(46.2%) (15.2%)
537 104
(59.6%) (11.5%)
59 26 (50.4%) (22.2%)
(15.6%)
139
(17.0%) 39 (11.0%)
33
(7.9%)
36 (6.6%) 17 (10.9%) 1407 (12.6%) 84 (9.3%)
(66.2%) (8.5%) (10.1%)
Modified
Original
Modified
Original Modified Modified Modified Original
P,V
R,V
P,V
R,V P,V P, V P, V P, V
819 - 353 64
419 60
546 58
156 69 11123 67 900 59 117 63
526
(71.8%) 230
(75.7%)*** (21.8%)
96 86
(11.7)
77 44
(10.5%) (12.5%)
252
(71.2%)
406 (74.4%) 62 (39.8%)
39 35
(9.3%)
26 99
(8.4%)
(4.8%)
36 14
(18.1%)
(23.1%) (11.9%) 6127 1347 477
(55.1%)
492
(54.7%)
(12.1%) (4.3%)
57 76
(6.3%) (8.4%)
10 89 0 11 (8.5%) ((76.0%) (9.4%)
*P: prospective; R: retrospective; V: validation; D: derivation; **Missing data for 13 patients; *** TNM>1; N: number; VTE: venous thromboembolism; ***Tumor node metastasis>1.
1438
haematologica | 2020; 105(5)
