
Page 213 - Haematologica May 2020
P. 213
Impact of MYC increased copy number in DLBCL
extra-copies (EC) of MYC was not assessable in six cases. In the remaining 51, 3-10 gene copies per cell were found in at least 50% of the analyzed nuclei. In detail, the distri- bution of MYC gene copies in the MYC-ICN cases was: 3 copies in 12 cases (24%), 4 copies in 19 (37%), 5 copies in 8 (15%), 6 copies in 4 (8%), 7 copies in 5 (10%), and 8-10 copies in 3 (6%). Of note, more than 60% of cases pre- sented 3-4 copies of MYC. Since ICN aberration was iden- tified during routine MYC analysis for which the break- apart probe is regularly used in our laboratory, informa- tion on the copies of chromosome 8 was available in only 11 cases showing MYC-ICN, where a single centromeric chromosome 8 probe was also used. No abnormal copies of chromosome 8 were detected in any of these cases, whereas identical MYC-ICN was found, thus excluding polysomy as cause of MYC-ICN.
An excess of copies of BCL2 (BCL2-ICN) and BCL6 (BCL6-ICN) was also found in these cases (in 44% and 27%, respectively), whereas BCL2 and BCL6 transloca- tions (BCL2-T and BCL6-T) were observed in 23% and 20% of cases with numerical aberrations of MYC, respec- tively (Table 1).
Clinical impact of numerical and structural aberrations of MYC
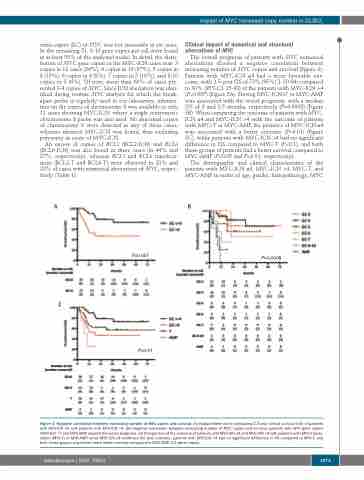
The overall prognosis of patients with MYC numerical aberrations showed a negative correlation between increasing number of MYC copies and survival (Figure 3). Patients with MYC-ICN ≤4 had a more favorable out- come, with 2.5-year OS of 73% (95%CI: 50-84) compared to 30% (95%CI: 15-43) of the patients with MYC-ICN >4 (P=0.007) (Figure 3A). Having MYC-ICN>7 or MYC-AMP was associated with the worst prognosis, with a median OS of 8 and 8.5 months, respectively (P=0.0008) (Figure 3B). When comparing the outcome of patients with MYC- ICN ≤4 and MYC-ICN >4 with the outcome of patients with MYC-T or MYC-AMP, the presence of MYC-ICN ≤4 was associated with a better outcome (P=0.01) (Figure 3C), while patients with MYC-ICN >4 had no significant difference in OS compared to MYC-T (P=0.1), and both these groups of patients had a better survival compared to MYC-AMP (P=0.05 and P=0.01, respectively).
The demographic and clinical characteristics of the patients with MYC-ICN ≤4, MYC-ICN >4, MYC-T, and MYC-AMP in terms of age, gender, histopathology, MYC
AB
C
P=0.007
P=0.0008
P=0.01
Figure 3. Negative correlation between increasing number of MYC copies and survival. (A) Kaplan-Meier curve comparing 2.5 year overall survival (OS) of patients with MYC-ICN ≤4 and patients with MYC-ICN >4. (B) Negative correlation between increasing number of MYC copies and survival: patients with MYC gene copies (MYC-GC) >7 and MYC-AMP showed the worse prognosis. (C) Comparison of the outcome of patients with MYC-ICN ≤4 and MYC-ICN >4 with patients with MYC translo- cation (MYC-T) or MYC-AMP: while MYC-ICN ≤4 conferred the best outcome, patients with MYC-ICN >4 had no significant difference in OS compared to MYC-T, and both these groups of patients had a better survival compared to MYC-AMP; GC: gene copies.
haematologica | 2020; 105(5)
1373
