
Page 159 - Haematologica May 2020
P. 159
Resistance to Notch1 neutralizing antibody
when they presented ~20-25% circulating blasts (Figure 1A). Percentages of T-ALL cells in the spleen were evalu- ated at sacrifice, confirming an almost complete infiltra- tion (>87%) of this hematopoietic organ by leukemic cells both in control and OMP52M51-resistant mice (Online Supplementary Figure S1A). In PDTALL19 model, leukemia
AC
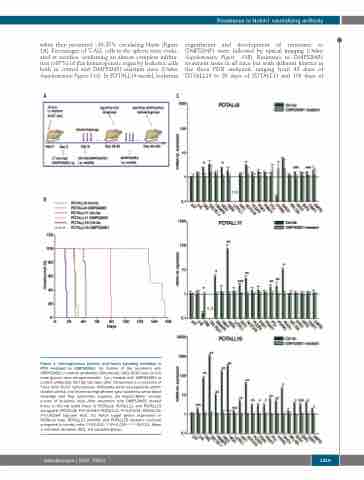
engraftment and development of resistance to OMP52M51 were followed by optical imaging (Online Supplementary Figure S1B). Resistance to OMP52M51 treatment arose in all mice but with different kinetics in the three PDX analyzed, ranging from 43 days of PDTALL19 to 80 days of PDTALL11 and 156 days of
B
Figure 1. Heterogeneous kinetics and Notch signaling inhibition in PDX resistant to OMP52M51. (A) Outline of the treatment with OMP52M51 or control antibodies (Rituximab). NOD/SCID mice (n=5-6 mice/group) were intraperitoneally (i.p.) treated with OMP52M51 or control antibodies (Ctrl Ab) two days after intravenous (i.v.) injection of T-ALL cells (5x10⁶ cells/mouse). Antibodies were subsequently admin- istrated weekly and leukemia engraftment was tracked by serial blood drawings and flow cytometric analysis. (B) Kaplan-Meier survival curves of leukemic mice after treatment with OMP52M51 (dotted lines) or Ctrl Ab (solid lines) of PDTALL8, PDTALL11 and PDTALL19 xenografts (PDTALL8: P=0.00343; PDTALL11: P=0.00124; PDTALL19: P=0.00264 log-rank test). (C) Notch target genes expression in PDTALL8 (top), PDTALL11 (middle) and PDTALL19 (bottom) resistant compared to control cells (*P≤0.001; **P=0.029; *** P≤0.01. Mean ± standard deviation [SD], 3-5 samples/group).
haematologica | 2020; 105(5)
1319
