
Page 142 - Haematologica May 2020
P. 142
A. Sharma et al.
healthy stem cell donors and five MLL-AF9 positive AML patients in colony forming cell (CFC) assays. Colony num- bers and size were significantly reduced in MLL-AF9 pos- itive AML cells treated with anti-MN1 siRNA compared to CD34+ cells from healthy donors when normalized to control siRNA treated cells (Figure 7A and B). Cell num- bers from CFC assays were also found significantly reduced in MLL-AF9 positive AML cells treated with anti- MN1 siRNA (Figure 7C). In order to exclude toxic effects
of the LNP/siRNA formulation, we tested an additional anti-MN1 siRNA (MN1 siRNA-3) and found similar spe- cific inhibitory effects with anti-MN1 siRNA-3 against MLL-AF9 positive primary human AML cells (Online Supplementary Figure S16B and C). Thus, MN1 expression is critical for proliferation of MLL-transformed leukemic cells while it has no effect on CD34+ cells from healthy donors, suggesting MN1 as a therapeutic target in MLL- transformed AML.
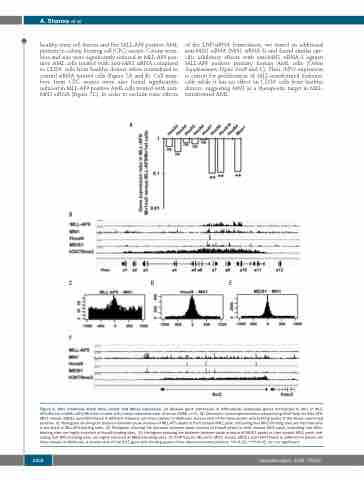
B
A
CDE
F
Figure 6. Mn1 maintains distal Hoxa cluster and Meis1 expression. (A) Relative gene expression of differentially expressed genes normalized to Abl1 in MLL- AF9/Mn1wt andMLL-AF9/Mn1null murine cells [mean±standard error of mean (SEM), n=3]. (B) Chromatin immunoprecipitation-sequencing (ChIP-Seq) for MLL-AF9, MN1, Hoxa9, MEIS1 and H3K79me2 in different leukemic cell lines (details in Methods). Screen shot of the Hoxa cluster with binding peaks of the above mentioned proteins. (C) Histogram showing the distance between peak maxima of MLL-AF9 peaks to their closest MN1 peak, indicating that MN1-binding sites are less frequent- ly enriched at MLL-AF9-binding sites. (D) Histogram showing the distance between peak maxima of Hoxa9 peaks to their closest MN1 peak, indicating that MN1- binding sites are highly enriched at Hoxa9-binding sites. (E) Histogram showing the distance between peak maxima of MEIS1 peaks to their closest MN1 peak, indi- cating that MN1-binding sites are highly enriched at MEIS1-binding sites. (F) ChIP-Seq for MLL-AF9, MN1, Hoxa9, MEIS1 and H3K79me2 in different leukemic cell lines (details in Methods). A screen shot of the Bcl2 gene with binding peaks of the aforementioned proteins. *P<0.05; **P<0.01; ns: not significant.
1302
haematologica | 2020; 105(5)
