
Page 116 - Haematologica May 2020
P. 116
B.Z. Carter et al.
A
B
C
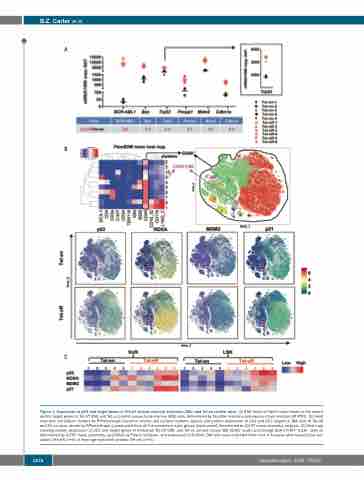
Figure 1. Expression of p53 and target genes in Tet-off chronic myeloid leukemia (CML) and Tet-on control mice. (A) RNA levels of Trp53 (also shown in the insert) and its target genes in Tet-off CML and Tet-on control mouse bone marrow (BM) cells, determined by Taq-Man real-time polymerase chain reaction (RT-PCR). (B) Heat map and cell subset clusters by RPhenoGraph based on mouse cell surface markers (upper) and protein expression of p53 and p53 targets in BM cells of Tet-off and Tet-on mice, shown by RPhenoGraph (constructed from all the samples in each group) (lower panel) determined by CyTOF mass cytometry analysis. (C) Heat map showing protein expression of p53 and target genes in individual Tet-off CML and Tet-on control mouse BM CD45+ (bulk) and lineage-SCA-1+C-KIT+ (LSK) cells as determined by CyTOF mass cytometry, quantified by FlowJo software, and expressed in ArcSinh. BM cells were collected from mice 3-4 weeks after tetracycline ces- sation (Tet-off) (n=6) or from age-matched controls (Tet-on) (n=5).
1276
haematologica | 2020; 105(5)
