
Page 307 - Haematologica April 2020
P. 307
HSC-GT for herPAP
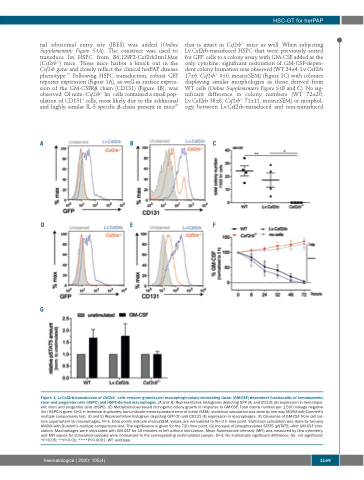
nal ribosomal entry site (IRES) was added (Online Supplementary Figure S1A). The construct was used to transduce lin– HSPC from B6;129P2-Csf2rb2tm1Mur (Csf2rb-/-) mice. These mice harbor a knock out in the Csf2rb gene and closely reflect the clinical herPAP disease phenotype.17 Following HSPC transduction, robust GFP reporter expression (Figure 1A), as well as surface expres- sion of the GM-CSFRβ chain (CD131) (Figure 1B), was observed. Of note, Csf2rb-/- lin– cells contained a small pop- ulation of CD131+ cells, most likely due to the additional and highly similar IL-3 specific β-chain present in mice20
that is intact in Csf2rb-/- mice as well. When subjecting Lv.Csf2rb-transduced HSPC that were previously sorted for GFP+ cells to a colony assay with GM-CSF added as the only cytokine, significant restoration of GM-CSF-depen- dent colony formation was observed (WT 24±4, Lv.Csf2rb 17±6, Csf2rb-/- 0±0, mean±SEM) (Figure 1C) with colonies displaying similar morphologies as those derived from WT cells (Online Supplementary Figure S1B and C). No sig- nificant difference in colony numbers (WT 72±20, Lv.Csf2rb 38±8, Csf2rb-/- 71±11, mean±SEM) or morphol- ogy between Lv.Csf2rb-transduced and non-transduced
ABC
DEF
G
Figure 1. Lv.Csf2rb-transduction of Csf2rb-/- cells restores granulocyte/macrophage-colony-stimulating factor (GM-CSF)-dependent functionality of hematopoietic stem and progenitor cells (HSPC) and HSPC-derived macrophages. (A and B) Representative histograms depicting GFP (A) and CD131 (B) expression in hematopoi- etic stem and progenitor cells (HSPC). (C) Methylcellulose-based clonogenic colony growth in response to GM-CSF. Total colony number per 1,500 lineage negative (lin-) HSPC is given. N=2 in technical duplicates; bars indicate mean±standard error of mean (SEM); statistical calculation was done by one-way ANOVA with Dunnett’s multiple comparisons test. (D and E) Representative histogram depicting GFP (D) and CD131 (E) expression in macrophages. (F) Clearance of GM-CSF from cell cul- ture supernatant by macrophages. N=3. Data points indicate mean±SEM. Values are normalized to the 0 h time point. Statistical calculation was done by two-way ANOVA with Dunnett’s multiple comparisons test. The significance is given for the 72h time point. (G) Increase of phosphorylated STAT5 (pSTAT5) after GM-CSF stim- ulation. Macrophages were stimulated with GM-CSF for 15 minutes or left without stimulation. Mean fluorescence intensity (MFI) was measured by flow cytometry, and MFI values for stimulated samples were normalized to the corresponding unstimulated sample. N=3. No statistically significant difference. Ns: not significant; *P<0.05; **P<0.01; ****P<0.0001. WT: wild-type.
haematologica | 2020; 105(4)
1149
