
Page 234 - Haematologica April 2020
P. 234
A. Larocca et al.
sided P-values adjusted for age, ISS stage, cytogenetic risk as deter- mined by FISH, Karnofsky Performance Status (PS) and extramedullary disease (yes vs. no) (main model). Subgroup analy- ses were performed to determine the consistency of treatment effects of VMP vs. Rd-R in the main model in the different sub- groups using interaction terms between treatment and cytogenet- ics [also with single deletion and translocation, del(17p), t(4;14) and t(14;16)], ISS stage (I vs. II/III), age (≤75 vs. >75 years), Karnofsky PS (90-100 vs. 70-80 vs. 60) and extramedullary disease. The null hypothesis examined with the interaction test was that the HR of the comparison VMP vs. Rd-R would be the same in each subgroup. The models were adjusted for age as a continuous variable. Multivariate Cox models with a three-way interaction between treatment (VMP vs. Rd-R), cytogenetics (high-risk vs. standard-risk, missing vs. standard-risk) and age (≤75 vs. >75 years) were performed to evaluate the effect of treatment in different cytogenetic and age subgroups. The models were adjusted for other factors included in previous analyses. The different effect of VMP vs. Rd-R in cytogenetic subgroups was confirmed by a sen-
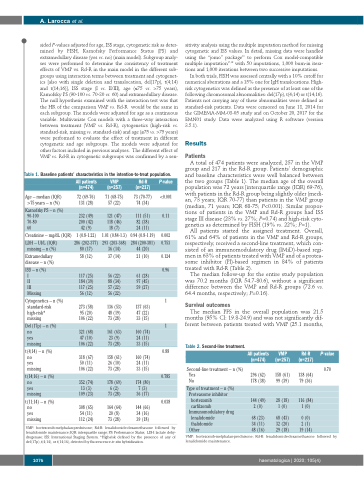
Table 1. Baseline patients’ characteristics in the intention-to-treat population.
sitivity analysis using the multiple imputation method for missing cytogenetic and ISS values. In detail, missing data were handled using the “jomo” package16 to perform Cox model-compatible multiple imputation17,18 with 50 imputations, 1,000 burn-in itera- tions and 1,000 iterations between two successive imputations.
In both trials, FISH was assessed centrally with a 10% cutoff for numerical aberrations and a 15% one for IgH translocations. High- risk cytogenetics was defined as the presence of at least one of the following chromosomal abnormalities: del(17p), t(4;14) or t(14;16). Patients not carrying any of these abnormalities were defined as standard-risk patients. Data were censored on June 18, 2014 for the GIMEMA-MM-03-05 study and on October 20, 2017 for the EMN01 study. Data were analyzed using R software (version 3.5.1).
Results
Patients
A total of 474 patients were analyzed, 257 in the VMP group and 217 in the Rd-R group. Patients’ demographic and baseline characteristics were well balanced between the two groups (Table 1). The median age of the overall population was 72 years [interquartile range (IQR) 69-76), with patients in the Rd-R group being slightly older (medi- an, 73 years; IQR 70-77) than patients in the VMP group (median, 71 years; IQR 68-75; P<0.001). Similar propor- tions of patients in the VMP and Rd-R groups had ISS stage III disease (23% vs. 27%; P=0.74) and high-risk cyto- genetics as determined by FISH (19% vs. 22%; P=1).
All patients started the assigned treatment. Overall, 61% and 64% of patients in the VMP and Rd-R groups, respectively, received a second-line treatment, which con- sisted of an immunomodulatory drug (IMiD)-based regi- men in 63% of patients treated with VMP and of a protea- some inhibitor (PI)-based regimen in 84% of patients treated with Rd-R (Table 2).
The median follow-up for the entire study population was 70.2 months (IQR 54.7-80.6), without a significant difference between the VMP and Rd-R groups (72.6 vs. 64.4 months, respectively; P=0.16).
Survival outcomes
The median PFS in the overall population was 21.5 months (95% CI: 19.8-24.9) and was not significantly dif- ferent between patients treated with VMP (25.1 months,
Age – median (IQR) >75 years – n (%)
Karnofsky PS – n (%) 90-100
70-80
60
Creatinine – mg/dL (IQR)
LDH – UI/L (IQR)
missing – n (%)
Extramedullary disease – n (%)
ISS–n(%) I
II
III Missing
Cytogenetics – n (%) standard-risk high-risk*
missing
Del(17p) – n (%) no
yes
missing
t(4;14) – n (%) no
yes missing
t(14;16) – n (%) no
yes
missing
t(11;14) – n (%) no
yes
missing
All patients (n=474)
72 (69-76) 131 (28)
232 (49) 200 (42) 42 (9)
1 (0.8-1.22)
286 (202-377)
80 (17) 58 (12)
117 (25) 184 (39) 117 (25) 56 (12)
273 (58) 95 (20) 106 (22)
321 (68) 47 (10) 106 (22)
318 (67) 50 (11) 106 (22)
352 (74) 13 (3) 109 (23)
308 (65) 54 (11) 112 (24)
VMP (n=257)
71 (68-75) 57 (22)
121 (47) 118 (46) 18 (7)
1.01 (0.84-1.3)
293 (203-368)
36 (14) 37 (14)
56 (22) 88 (34) 57 (22) 56 (22)
136 (53) 48 (19) 73 (28)
161 (63) 23 (9) 73 (28)
158 (61) 26 (10) 73 (28)
178 (69) 6 (2) 73 (28)
164 (64) 20 (8) 73 (28)
Rd-R (n=217)
73 (70-77) 74 (34)
111 (51) 82 (38) 24 (11)
0.94 (0.8-1.19)
284 (200-381)
44 (20) 21 (10)
61 (28) 97 (45) 59 (27)
137 (63) 47 (22) 33 (15)
160 (74) 24 (11) 33 (15)
160 (74) 24 (11) 33 (15)
174 (80) 7 (3) 36 (17)
144 (66) 34 (16) 39 (18)
P-value <0.001
0.11
0.002
0.753
0.124
0.96
1
1
0.88
0.785
0.038
Table 2. Second-line treatment.
Second-line treatment – n (%) Yes
No
Type of treatment – n (%) Proteasome inhibitor
bortezomib
carfilzomib Immunomodulatory drug
lenalidomide
thalidomide
Other
All patients (n=474)
296 (62) 178 (38)
144 (49) 2 (0)
68 (23) 34 (11) 48 (16)
VMP (n=257)
158 (61) 99 (39)
28 (18) 1 (0)
68 (43) 32 (20) 29 (18)
Rd-R (n=217)
138 (64) 79 (36)
116 (84) 1 (0)
0 (0)
2 (1)
19 (14)
P-value 0.70
VMP: bortezomib-melphalan-prednisone; Rd-R: lenalidomide-dexamethasone followed by lenalidomide maintenance; IQR: interquartile range; PS: Performance Status; LDH: lactate dehy- drogenase; ISS: International Staging System. *High-risk defined by the presence of any of del(17p),t(4;14),or t(14;16),detected by fluorescence in situ hybridization.
VMP: bortezomib-melphalan-prednisone; Rd-R: lenalidomide-dexamethasone followed by lenalidomide maintenance.
1076
haematologica | 2020; 105(4)
