
Page 227 - Haematologica April 2020
P. 227
Fractures and survival in MM
Table 1. Characteristics of patients with multiple myeloma with and without fractures after multiple myeloma diagnosis.
Variable
Number of patients
Male/female %
Age mean
Agemedian 72 72 72
All Fracture at the same day or after MM diagnosis
14,013 3,235 (23.1%)
No fractures at the same day or after MM diagnosis
10,778 (76.9%)
54.9/45.1 45.7/54.3 70.8 70.4
57.6/42.4 70.9
Age range
Year at MM diagnosis
1990-1999
2000-2013
MM: multiple myeloma.
20-99
5,462
8,551
29-97
1,211 (22.2%)
2,024 (23.7%)
20-99
4,251 (77.8%)
6,527 (76.3%)
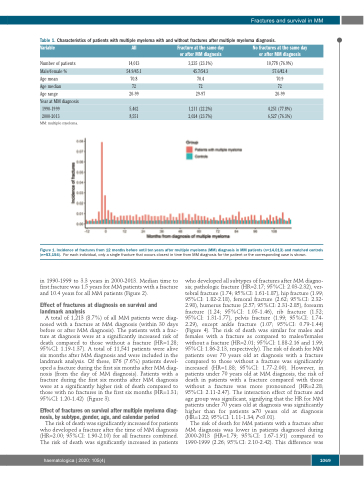
Figure 1. Incidence of fractures from 12 months before until ten years after multiple myeloma (MM) diagnosis in MM patients (n=14,013) and matched controls (n=53,154). For each individual, only a single fracture that occurs closest in time from MM diagnosis for the patient or the corresponding case is shown.
in 1990-1999 to 3.3 years in 2000-2013. Median time to first fracture was 1.5 years for MM patients with a fracture and 10.4 years for all MM patients (Figure 2).
Effect of fractures at diagnosis on survival and landmark analysis
A total of 1,213 (8.7%) of all MM patients were diag- nosed with a fracture at MM diagnosis (within 30 days before or after MM diagnosis). The patients with a frac- ture at diagnosis were at a significantly increased risk of death compared to those without a fracture (HR=1.28; 95%CI: 1.19-1.37). A total of 11,541 patients were alive six months after MM diagnosis and were included in the landmark analysis. Of these, 876 (7.6%) patients devel- oped a fracture during the first six months after MM diag- nosis (from the day of MM diagnosis). Patients with a fracture during the first six months after MM diagnosis were at a significantly higher risk of death compared to those with no fractures in the first six months (HR=1.31; 95%CI: 1.20-1.42) (Figure 3).
Effect of fractures on survival after multiple myeloma diag- nosis, by subtype, gender, age, and calendar period
The risk of death was significantly increased for patients who developed a fracture after the time of MM diagnosis (HR=2.00; 95%CI: 1.90-2.10) for all fractures combined. The risk of death was significantly increased in patients
who developed all subtypes of fractures after MM diagno- sis; pathologic fracture (HR=2.17; 95%CI: 2.03-2.32), ver- tebral fracture (1.74; 95%CI: 1.61-1.87), hip fracture (1.99; 95%CI: 1.82-2.18), femoral fracture (2.62; 95%CI: 2.32- 2.98), humerus fracture (2.57; 95%CI: 2.31-2.85), forearm fracture (1.24; 95%CI: 1.05-1.46), rib fracture (1.52; 95%CI: 1.31-1.77), pelvis fracture (1.99; 95%CI: 1.74- 2.29), except ankle fracture (1.07; 95%CI: 0.79-1.44) (Figure 4). The risk of death was similar for males and females with a fracture as compared to males/females without a fracture (HR=2.01; 95%CI: 1.88-2.16 and 1.99; 95%CI: 1.86-2.13, respectively). The risk of death for MM patients over 70 years old at diagnosis with a fracture compared to those without a fracture was significantly increased (HR=1.88; 95%CI: 1.77-2.00). However, in patients under 70 years old at MM diagnosis, the risk of death in patients with a fracture compared with those without a fracture was more pronounced (HR=2.28; 95%CI: 2.11-2.47). The interaction effect of fracture and age group was significant, signifying that the HR for MM patients under 70 years old at diagnosis was significantly higher than for patients ≥70 years old at diagnosis (HR=1.22; 95%CI: 1.11-1.34; P<0.01).
The risk of death for MM patients with a fracture after MM diagnosis was lower in patients diagnosed during 2000-2013 (HR=1.79; 95%CI: 1.67-1.91) compared to 1990-1999 (2.26; 95%CI: 2.10-2.42). This difference was
haematologica | 2020; 105(4)
1069
