
Page 125 - Haematologica April 2020
P. 125
TM+ monocytes in myelodysplastic syndromes
A
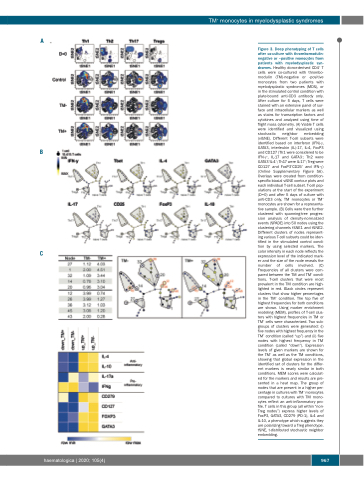
B and CD127 (Th1 were considered to be IFN-γ+, IL-17 and GATA3-; Th2 were GATA3+IL-4+; Th17 were IL-17+; Treg were CD127- and FoxP3+CD25+ and IFN-γ-) (Online Supplementary Figure S6). Overlays were created from condition- specific biaxial viSNE contour plots and each individual T-cell subset. T-cell pop- ulations at the start of the experiment (D=0) and after 5 days of culture with anti-CD3 only, TM- monocytes or TM+ monocytes are shown for a representa- tive sample. (B) Cells were then further clustered with spanning-tree progres- sion analysis of density-normalized events (SPADE) into 50 nodes using the clustering channels tSNE1 and tSNE2. Different clusters of nodes represent- ing various T-cell subsets could be iden- tified in the stimulated control condi- tion by using selected markers. The color intensity in each node reflects the expression level of the indicated mark- er and the size of the node reveals the number of cells involved. (C) Frequencies of all clusters were com- pared between the TM- and TM+ condi- tions. T-cell clusters that were most prevalent in the TM- condition are high- lighted in red. Black circles represent clusters that show higher percentages in the TM+ condition. The top five of highest frequencies for both conditions are shown. Using marker enrichment modeling (MEM), profiles of T-cell clus- ters with highest frequencies in TM- or TM+ cells were characterized. Two sub- groups of clusters were generated: (i) five nodes with highest frequency in the TM+ condition (called “up”) and (ii) five nodes with highest frequency in TM- condition (called “down”). Expression levels of given markers are shown for the TM+ as well as the TM- conditions, showing that global expression in the identified set of clusters for the differ- ent markers is nearly similar in both conditions. MEM scores were calculat- ed for the markers and results are pre- sented in a heat map. The group of nodes that are present in a higher per- centage in cultures with TM+ monocytes compared to cultures with TM- mono- cytes reflect an anti-inflammatory pro- file. T cells in this group (all within “non- Treg nodes”) express higher levels of FoxP3, GATA3, CD279 (PD-1), IL-4 and IL-10, a phenotype which suggests they are polarizing toward a Treg phenotype. tSNE, t-distributed stochastic neighbor
embedding.
C
Figure 3. Deep phenotyping of T cells after co-culture with thrombomodulin- negative or –positive monocytes from patients with myelodysplastic syn- dromes. Healthy donor-derived CD4+ T cells were co-cultured with thrombo- modulin (TM)-negative or -positive monocytes from two patients with myelodysplastic syndromes (MDS), or in the stimulated control condition with plate-bound anti-CD3 antibody only. After culture for 5 days, T cells were stained with an extensive panel of sur- face and intracellular markers as well as stains for transcription factors and cytokines and analyzed using time of flight mass cytometry. (A) Viable T cells were identified and visualized using stochastic neighbor embedding (viSNE). Different T-cell subsets were identified based on interferon (IFN)-γ, GATA3, interleukin (IL)-17, IL-4, FoxP3
haematologica | 2020; 105(4)
967
