
Page 335 - Haematologica March 2020
P. 335
Acute Lymphoblastic Leukemia
Radiation exposure from computerized tomography and risk
of childhood leukemia: Finnish register-based case-control study of childhood leukemia (FRECCLE)
Atte Nikkilä,1 Jani Raitanen,2,3 Olli Lohi1,4 and Anssi Auvinen2,3,5
1Faculty of Medicine and Biosciences, University of Tampere; 2Faculty of Social Sciences, University of Tampere; 3UKK Institute for Health Promotion Research, Tampere; 4Tampere Center for Child Health Research, University of Tampere and Tampere University Hospital and 5STUK – Radiation and Nuclear Safety Authority, Helsinki, Finland
doi:10.3324/haematol.2019.245704 ©2020 Ferrata Storti Foundation
With reference to the article Nikkilä A, Raitanen J, Lohi O, Auvinen A. Radiation exposure from computerized tomography and risk of childhood leukemia: Finnish register-based case-control study of childhood leukemia (FRECCLE). Haematologica. 2018;103(11):1873-1880, it has come to the authors’ attention that the reported total number of computed tomography (CT) scans in our article was incorrect. The reported numbers were, in fact, the expected numbers prior to the CT scan collection from hospitals. Fortunately, this does not affect the number of CT scans to the study subjects and, thus, all results regarding childhood leukemia remain unchanged.
The errors and their corrections are listed below.
An incorrect sentence appeared in the November 2018 issue, page 1876.
Data on a total of 80,783 pediatric CT scans were obtained and of those, 49 CT scans were performed on the study subjects, excluding the 2-year latency period (Table 1). Half (n=25) were head scans, and 19 were lung scans. Of the CT scans, 36 were performed on 15 (1.4%) cases and 13 scans on 10 (0.3%) controls.
The corrected version of the sentence is published below.
Data on a total of 72,673 pediatric CT scans were obtained and of those, 49 CT scans were performed on the study subjects, excluding the 2-year latency period (Table 1). Half (n=25) were head scans, and 19 were lung scans. Of the CT scans, 36 were performed on 15 (1.4%) cases and 13 scans on 10 (0.3%) controls.
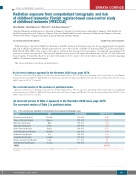
An incorrect version of Table 1 appaered in the November 2018 issue, page 1875. The corrected version of Table 1 is published below.
Table 1. The collection and availability of electronically stored computed tomography scans.
Hospital
Helsinki University Hospital
Tampere University Hospital Oulu University Hospital
Turku University Hospital
Kuopio University Hospital Central Finland Central Hospital Satakunta Central Hospital Seinäjoki Central Hospital Päijänne Tavastia Central Hospital North Karelia Central Hospital TOTAL
City
Helsinki
Tampere Oulu Turku Kuopio Jyväskylä Pori Seinäjoki Lahti Joensuu
Data availability
1990–2011
1978–2011 1993–2011 1996–2011 1996–2011 2002–2011 1995–2011 1999–2011 2000–2011 1993–2011
Number of CT scans
28,459
17,077 8,722 5,806 4,115 1,635 2,032 1,347 447 3,033 72,673
All Finnish university hospitals are listed first and separated slightly are the five chosen central hospitals.The reported numbers represent the data obtained before exclusions or har- monization.
haematologica | 2020; 105(3)
849
ERRATA CORRIGE
