
Page 202 - Haematologica March 2020
P. 202
H. Kuusanmäki et al.
sensitivity whereas high MCL1 and BCL2A1 expression was associated with resistance (Figure 5F). These findings were also presented earlier by two different research groups.32,33
Taken together, the gene expression data of mononu- clear cell enriched AML samples indicate that M4/5 AML have low BCL2 but high MCL1 and BCL2A1 expression and increased inflammatory signaling. Thus, the data sup- port the decreased venetoclax sensitivity we observed with the total mononuclear cell fraction of M4/5 samples. MEK and JAK inhibitors sensitize venetoclax-resistant blast cells to venetoclax
Next, we studied whether mutations might explain the observed differences in blast specific venetoclax respons-
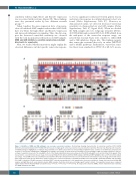
es, but no significant correlation between genetic lesions and venetoclax response in our limited patient cohort was found (Online Supplementary Table S7). However, as demonstrated earlier, we detected decreased venetoclax sensitivity in chemorefractory and M5 samples (Online Supplementary Table S7, Figure 4A-E). When we divided the AML samples into two subgroups (sensitive DSS 21- 43, IC50<20nM and resistant DSS 0-21, IC50>20nM) from the mid-point of the venetoclax response range, we noticed that resistant blasts were sensitive to either MEK and/or JAK inhibitors (Figure 6A). This finding suggests that venetoclax resistant blasts rely on either JAK/STAT and/or MAPK pathways. Furthermore, venetoclax sensi- tive blasts were enriched for NPM1 (8 of 25, 32% in sen-
A
B
Figure 6. Inhibition of MEK and JAK pathways can overcome venetoclax resistance. (A) Heatmap showing characteristics of venetoclax sensitive (IC50<20nM, DSS>20) and resistant blasts (IC50>50nM, DSS<20) based on single agent venetoclax response measured by flow cytometry (FC) (top row). Blast-specific response of individual drugs is highlighted according to drug sensitivity score (DSS) values with red corresponding to high DSS value and blue to low DSS value. Blast-specific response to venetoclax combinations is highlighted according to percentage of apoptotic/dead cells with red corresponding to high percentage and blue to low per- centage of apoptotic/dead cells. The synergistic effect of the drug combination was assessed based on the BLISS synergistic score and is shown in the graph. Other characteristics covered include disease stage, molecular profiling, French-American-British (FAB) subtype with M4 and M5 highlighted blue and FC-determined blast percentage. Overall BM venetoclax sensitivity measured with CellTiter-Glo (CTG) (bottom row) is used to demonstrate how low blast cell percentage affects DSS values when compared to blast-specific DSS values. (B) Dot scatter plots of venetoclax (50nm) + ruxolitinib (300nM), venetoclax (50nM) + trametinib (25nM), and cytarabine (1000nM) + idarubicin (30nM) responses in healthy CD45+ leukocytes, granulopoietic cells, lymphocytes, monocytes and blasts. Orange dots represent healthy BM samples and light blue dots acute myloid leukemia (AML) samples. Dark blue dots represent single agent toxicity to blasts. Cell population means were compared against blasts with the Kruskal-Wallis test (Dunn’s test, *P<0.05, **P<0.001, ***P<0.0001). R: relapse; Rf: refractory; CMML: chronic myelomonocytic leukemia; CL: CMML transitioned to AML.
716
haematologica | 2020; 105(3)
