
Page 198 - Haematologica March 2020
P. 198
H. Kuusanmäki et al.
ple t-tests P-values were adjusted using the Benjamin-Hochberg method (P<0.10 used to determine significance). The Kruskal- Wallis test was used when more than two groups were tested and significant comparisons were validated with post-hoc analysis (Dunn’s test). Statistical dependence between two variables was assessed by Spearman’s rank correlation.
Results
Analysis of the AML bone marrow compartment
To measure blast-specific drug responses in mononu- clear cell (MNC) enriched BM AML samples, we tested 34 AML samples collected at diagnosis or relapse with seven drugs. Following a 72-hour drug treatment we analyzed the samples by both FC and CTG-based cell viability assays (Figure 1A). With the CTG assay we measured the overall BM-MNC sensitivity, while with the FC analysis the number of viable cells in different cell populations was measured. We used four cell surface markers (CD45,
A
CD34, CD33, CD14) to identify the major leukocyte pop- ulations present in the AML BM: leukemic blasts, imma- ture granulocytes, promonocytes/monocytes and lympho- cytes (Figure 1B). In the studied samples, the fraction of blasts out of CD45+ positive leukocytes varied between 17-92% and the lymphocyte population ranged from 1-49% (Online Supplementary Table S3). As expected, we observed high numbers of monocytic cells in FAB M4/5 samples, whereas M0/1 samples mainly consisted of blasts and lymphocytes (Figure 1C). After 72-hours in cul- ture, we observed monocytic maturation in several M5 samples,24 and in many samples the granulopoietic cell population diminished or was completely lost (Online Supplementary Figure S2).
FC versus homogeneous cell viability assay-based drug sensitivity profiling
In order to determine the correlation between drug sen- sitivity of the samples measured by FC or CTG-based methods, we converted the cell viability readouts from
BC
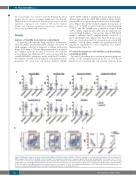
Figure 3. Maturation stage of acute myeloid leukemia (AML) cells affects drug sensitivities. (A) Drug sensitivity score (DSS) values for distinct cell populations in 33 AML samples (blue) and 2-3 healthy controls (orange). Cell population means were compared against blasts with Kruskal-Wallis test (Dunn’s test, *P<0.05, **P<0.001, ***P<0.0001). (B) Representative flow cyometric (FC) scatter plots of the effects of venetoclax and trametinib on blasts, monocytic cells (CD14+) and lymphocytes after 72h drug treatment with the indicated concentrations. Absolute cell counts inside the gates were calculated after drug treatment and normalized to the cell counts in the DMSO-treatment wells (represented as percentages). (C) Inter- and intra-patient comparison of the DSS values in blasts and monocytic cell fraction calculated with Mann-Whitney U test. HSPC: healthy hematopoietic stem/progenitor cells.
712
haematologica | 2020; 105(3)
