
Page 141 - Haematologica March 2020
P. 141
Risk factors for post-HCT outcomes in CMML
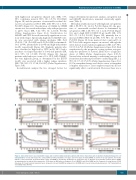
with higher-risk cytogenetics [hazard ratio (HR), 3.77; 95% confidence interval (95% CI): 1.9-7.5; P=0.0002)] (Figure 1B) and the presence of measurable residual dis- ease by cytogenetics at HCT (HR, 2.55; 95% CI: 1.3-5.0; P=0.007) (Figure 1C). Classification of CMML by WHO criteria was associated with relapse only with progression to ≥20% blasts (HR, 3.61; 95% CI: 1.2-10.5; P=0.02) (Online Supplementary Figure S1A). Stratification for MDAPS and CPSS showed statistically significant associa- tions with relapse. Specifically, high risk by MDAPS crite- ria was associated with relapse incidence [HR, 5.24 (P=0.03), 7.15 (P=0.008) and 9.41 (P=0.005) for intermedi- ate-1 (n=34), intermediate-2 (n=46) and high-risk patients (n=15), respectively] (Figure 1D). Similarly, patients who were classified as high risk by CPSS (n=30; 25%) had a incidence of relapse than that of lower-risk patients (HR, 14.3; 95% CI: 1.9-108; P=0.01) (Figure 1E). Among patients with leukocyte counts <13 × 109/L (MD-CMML), the very high-risk group, as determined by the IPSS-R (n=20), was associated with a higher relapse incidence (HR, 7.82; 95% CI: 1.7-35; P=0.007) (Online Supplementary Figure S1B).
In multivariate analysis the two strongest factors for
relapse determined in univariate analysis, cytogenetic risk and MDAPS classification, remained statistically signifi- cant (Table 4).
Overall mortality increased with high-risk cytogenetics (HR, 1.88; 95% CI: 1.2-3.0; P=0.01) (Figure 1F), the pres- ence of measurable residual disease as determined by cytogenetics (HR, 1.65; 95% CI: 1.1-2.6; P=0.02) (Figure 1G), and a high HCT-CI [HCT-CI ≥4 (n=45): HR, 1.99; 95% CI: 1.2-3.4; P=0.01) (Figure 1H), primarily due to increased NRM (HCT-CI ≥4: HR, 3.39; 95% CI: 1.5-7.5; P=0.003) (Figure 1I). Bone marrow blast counts ≥20% at HCT also had a negative impact on survival, although the effect did not reach statistical significance (HR, 1.67; 95% CI: 0.9-3.2; P=0.13) (Online Supplementary Figure S1C). Risk stratification by the prognostic scoring systems was gen- erally less predictive of survival, likely due to a high inci- dence of NRM (Online Supplementary Figure S1D-F). Survival after reduced intensity conditioning was not dif- ferent from that after myeloablative conditioning (HR, 1.1; 95% CI: 0.7-1.9; P=0.71) (Online Supplementary Figure S1G, H). Pre-transplant therapy and disease status at transplant (complete remission vs. non-complete remission) did not significantly affect overall survival. However, there was a
ABC
DEF
GHI
Figure 1. Clinical risk factors associated with relapse and overall mortality/survival in patients with chronic myelomonocytic leukemia following hematopoietic cell transplantation. Overall and relapse-free survival (RFS) and the probabilities of relapse and non-relapse mortality (NRM) are shown for all 129 patients. Tick marks indicate censored patients. (A) Survival, RFS, relapse and NRM for all patients. (B) Relapse by cytogenetic risk. (C) Relapse by measurable residual disease (MRD) at transplantation as indicated by cytogenetics. (D) Relapse by MD Anderson Prognostic Score (MDAPS) and (E) by CMML-specific Prognostic Scoring System (CPSS) risk group. (F) Overall survival dependent upon cytogenetic risk and (G) MRD by cytogenetics. (H) NRM and (I) overall survival by Hematopoietic Cell Transplantation- Comorbidyt Index (HCT-CI).
haematologica | 2020; 105(3)
655
