
Page 129 - Haematologica March 2020
P. 129
Iron chelation in lower risk MDS patients
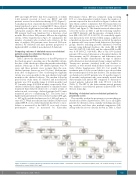
2007 and April 25th 2017, had been registered, of which 1,161 patients received at least one RBCT and 224 patients received iron chelation therapy (ICT) (Figure 1). A small proportion of patients had received ICT without being transfused or prior to starting RBCT, these subjects generally had a high ferritin level and were excluded from subsequent analyses. Of the 1,161 transfused patients, 850 patients had been transfused for a duration of ≥2 months. Out of these 850 patients, 689 met the eligibility criteria. Online Supplementary Figure S1 summarizes the number of patients who reached each criterion. At the time of analysis, 236 patients were deceased (154 non- chelated, 82 chelated) and nine patients progressed to high-risk MDS or AML (4 non-chelated, 5 chelated).
Comparing outcome of chelated versus non-chelated patients using iron chelation therapy as a time-dependent variable
Table 1 shows the characteristics of the 689 patients at the check-up prior to meeting one of the eligibility criteria; the date of this check-up is when the patients entered this analysis. Mean age of the 199 chelated patients was 70 years and these patients were younger than the non- chelated patients (mean age was 76 years). Median time from date of diagnosis to date of meeting the eligibility criteria was seven months in the non-chelated and eight months in the chelated subjects. The median follow-up period from study entry for chelated and non-chelated patients was 39.4 months (range 4.1-106.6 months) and 27.1 months (range 2.5-105.6 months), respectively. Non- chelated subjects had a higher number of cumulative units transfused than chelated subjects (4 vs. 2 units) at time of inclusion and, on average, chelated patients had 13 units transfused prior to commencing ICT. The latter had a higher median ferritin level recorded at baseline (675 mg/L vs. 547 mg/L), and this had increased to 1,221 mg/L prior to start of ICT. While non-chelated and chelated subjects had similar IPPS-R scores, chelated patients had fewer co-mor- bidities as measured by the MDS-CI score and a better performance status as measured by Karnofsky
Performance Status. OS was estimated using receiving ICT as a time-dependent variable, hence the number of patients reported in the risk table in Figure 2 reflects the time when a subject commences ICT. The hazard ratio for OS in the univariate analysis was 0.57 (95%CI: 0.45-0.73) (Table 1 and Figure 2). This benefit increased when adjust- ed for the factors in Table 1 and the following variables: sex, RBCT intensity, and the presence of ringed siderob- lasts (HR: 0.50, 95%CI: 0.34-0.74). No statistically signifi- cant interactions were detected when using a sophisticat- ed prediction-type model. When we restricted the analysis to patients who were treated with deferasirox (the largest group), thereby excluding possible differences between patients using different chelators, the crude HR for OS was 0.53 (95%CI: 0.40-0.69) and the adjusted HR for OS was 0.38 (95%CI: 0.24-0.60). Out of the 199 chelated patients, 150 received deferasirox as the initial chelator, 36 deferoxamine, and 13 deferiprone, and differences were seen in the baseline characteristics by type of chelator with deferasirox-treated patients being younger and fitter. Twenty-two patients switched from one chelator to another, or were treated with all three chelators consecu- tively (Online Supplementary Table S1), but usually the treatment period of the second chelator was shorter than the treatment period of the first chelator. The median time on chelation for all 199 patients was 13 months (range 3- 41 months) and patients who were initially treated with deferoxamine had inferior OS compared to deferasirox- treated patients (adjusted HR: 2.46, 95%CI: 1.12-5.41) (Table 1). The OS of the deferoxamine-treated patients was similar to non-chelated patients (adjusted HR: 0.98, 95%CI: 0.52-1.86).
Matching of chelated and non-chelated patients by propensity scores
The variables used in the propensity score matching are described in Online Supplementary Table S2 for all eligible patients by chelation status, initially excluding any miss- ing variables and then after multiple imputation (MI). Along with the factors already shown in Table 1, there
Figure 1. Number of registry patients by transfusion and chelation status. *Cumulative red blood cell transfusion (RBCT) units >15 or RBCT intensity of >1 RBC unit/month or serum ferritin >1000 mg/L.
haematologica | 2020; 105(3)
643
