
Page 287 - 2020_02-Haematologica-web
P. 287
Minnesota GvHD Risk Score
interquartile range 26-57). All patients had ≥6 months fol- low-up after steroid initiation (median 3.2 years, range 0.5-9 years).
The initial organ stage of GvHD at onset of steroid treat- ment is shown in Table 2. Initial GvHD organ involve- ment was skin only (45%), upper gastrointestinal (GI) only (5%), upper and/or lower GI only (33%), liver only (1%) or multi-organ (21%). At onset of steroid therapy, 11% had grade I GvHD, 53% patients had grade II GvHD, 30% had grade III GvHD and 6% had grade IV GvHD. Of the 355 patients, 79 (22%) had Minnesota HR GvHD and 276 (78%) had Minnesota SR GvHD. The median onset of GvHD treatment in SR patients was 37 days [range, 10- 170, interquartile range (IQR), 26.5-57] and 39 days (range, 13-156, IQR, 23-57) in HR patients.
Overall response (CR + PR) at day 28 was observed in 250 of 355 patients [70%: 95% confidence interval (CI), 65-75%]. CR was observed in 199 patients [56%: 95% CI, 51-61%) and PR in 51 patients [14%: 95% CI, 11-18%). CR/PR was significantly higher in the 276 SR versus 79 HR GvHD patients at day 14 (71% versus 56%, P<0.01), day 28 (74% versus 59%, P=0.02; Figure 1) and day 56 (68% versus 49%, P<0.01) after steroid initiation. Day 28 CR/PR did not differ by initial GvHD grade being 64%, 77%, 65% and 50% for grade I, II, III and IV (P=0.07), noting that Grade I, II and III had similar day 28 CR/PR. Evaluating high risk for each index as classified by Minnesota HR GvHD, grades III/IV for the Minnesota GvHD grading system, and grades C/D for the CIBMTR grading system, the positive predictive value for no response was 41% (95% CI, 30-52%), 38% (95% CI, 29- 47%) and 33% (95% CI, 27-40%), respectively.
TRM at six months was significantly higher in the HR (34%: 95% CI, 23-45%) versus SR patients [21%: 95% CI, 16-25%; P<0.01) as shown in Figure 2. TRM at six months was also higher in patients with no response to steroids at day 28 (44%: 95% CI, 32-55%) versus those who achieved a PR [16%: 95% CI, 6-27%) or CR (13%: 95% CI, 9-18%; P<0.01) as shown in Figure 3.
In multiple regression analysis, adjusting for clinically significant variables, the odds of day 28 CR/PR were lower in HR versus SR GvHD patients [odds ratio (OR) 0.5, 95% CI, 0.3-0.9, P=0.01). Donor type was the only other factor significantly associated with response. HLA matched URD BM/PBSC recipients were less likely to achieve a CR/PR at day 28 (OR 0.3, 95% CI, 0.2-0.7, P<0.01) versus HLA sibling donor BM/PBSC recipients, whereas single UCB graft recipients were 3.6 times as like- ly to respond (OR 3.6, 95% CI,1.4-9.2, P=0.01) and double UCB recipients 1.9 twice as likely to respond (OR 1.9, 95% CI,1.0-3.5, P=0.04) as shown in Table 3. There were no statistically significant interactions in donor, graft or other variables with response.
We also performed a logistic regression analysis of day 28 CR/PR only in the 159 BM/PBSC (non-UCB recipients). Compared to Minnesota SR GvHD patients, the HR group had OR of 0.2 of achieving a day 28 CR and 0.2 of achiev- ing CR/PR (both P<0.01). The Minnesota GvHD Risk Score also predicted CR/PR in the small number of patients with non-malignant disease as well (data not shown).
In multiple regression analysis, factors statistically sig- nificantly associated with greater TRM through 2 years included HR GvHD (Hazard Ratio (HzR) 1.8, 95% CI, 1.1- 2.7, P=0.01), and matched URD BM/PBSC recipients (HzR
2.0, 95% CI, 1.1-3.5, P=0.02). Lower TRM was associated with patients 18-35 years of age (HzR 0.6, 95% CI, 0.3- 1.1, P=0.02), single UCB (HzR 0.4, 95% CI, 0.2-1.0, p=0.04) and early onset (<28 days from HCT) GvHD (HzR 0.92, 95% CI, 0.87-0.97, P=0.05). Similarly, mortality through 2 years was higher in HR GvHD (HzR 1.7, 95% CI, 1.2-2.4, P<0.01), matched URD BM/PBSC recipients (HzR 1.8, 95% CI,1.1-3.0, P=0.01) and HCT-comorbidity
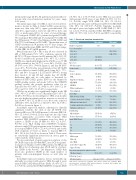
Table 1. Patient and transplant characteristics.
Characteristic
Number of patients
Year of transplant
1990-2000 2001-2007 2007-2010 2011-2016
Age, years Median (range)
Gender: male Disease
Acute leukemia CML
CLL/other leukemia MDS/MPN
HL/NHL
Other malignancies Non-malignant
Donor Type
HLA identical sibling
1 antigen mismatched sibling HLA matched unrelated
1 antigen mismatched unrelated Umbilical cord blood
Conditioning Myeloablative Reduced Intensity
Initial GvHD Grade
I II III IV
Organ involvement Multi-organ
Skin only
Liver Only
Lower GI +/- upper GI
Upper GI only
New cohort
355
112 (32%)
243 (68%)
49 (<1-75) 221 (62%)
196 (55%) 13 (4%) 20 (6%) 57 (16%) 20 (6%) 10 (3%) 39 (11%)
101 (28%) 2 (1%) 49 (14%) 8 (2%) 195 (55%)
178 (50%) 177 (50%)
39 (11%) 188 (53%) 108 (30%) 20 (6%)
76 (21%) 158 (45%) 2 (1%) 118 (33%) 19 (5%)
Old cohort
1723
581 (33%) 1142 (67%)
40 (<1-76) 1067 (62%)
741 (43%) 217 (13%) 73 (4%) 194 (11%) 236 (14%) 69 (4%) 193 (11%)
598 (35%) 73 (4%) 626 (36%) 164 (10%) 262 (15%)
37(47%) 42 (53%)
426 (25%) 953 (55%) 311 (18%) 33 (2%)
556 (32%) 910 (53%) 23 (1%) 346 (20%) 111 (6%)
30 (2-178)
4.9 years (0.3-17.7)
Days from transplant to initial steroids
Median (range) Follow-up (years)
Median (range)
37 (10-170)
3.2 years (0.5-9)
CML: chronic myelogenous leukemia; CLL: chronic lymphocytic leukemia; MDS: myelodysplastic syndrome; MPN: myeloproliferative neoplasm; HL: Hodgkin lym- phoma; NHL: Non-Hodgkin lymphoma.
haematologica | 2020; 105(2)
521
