
Page 221 - 2020_02-Haematologica-web
P. 221
BIRC3 mutations in CLL
The introduction of FCR was a breakthrough in the man- agement of young, fit CLL patients, leading to improve- ments in both PFS and overall survival compared to those achieved with previous treatment regimens. In both clinical trials and real-life cohorts,10-12 IGHV mutation status and TP53 disruption emerged as strong predictors of poor response to FCR. However, these molecular biomarkers do
Table 2. Univariate and multivariate analyses of progression-free survival.
not fully capture all high-risk patients destined to relapse. We propose BIRC3 mutations as a new biomarker for the identification of patients at high risk of FCR failure, simi- larly to cases harboring TP53 disruption. If validated in independent series, BIRC3 mutations may turn out as a new molecular predictor of FCR resistance that could be used to select patients to be treated with novel targeted agents.
Internal bootstrapping validation HR LCI UCI Bootstrapping selection (%)
Characteristics
Binet A
Binet B-C
IGHV mutated
IGHV unmutated
No11qdeletion
11q deletion
No 17p deletion
17p deletion
TP53 wildtype
TP53 mutated
BIRC3 wildtype
BIRC3 mutated
EGR2 wildtype
EGR2 mutated
ATM wildtype
7-y PFS (%)
40.3%
30.0% 49.3% 23.0% 33.4% 13.9% 33.0% nr 33.8% nr 32.2% nr 31.5% nr 32.5% nr
Median PFS (y)
4.5
4.6
6.5
3.9
5.0
3.6
4.8
1.1
5.4
2.8
4.8
2.2
4.7
1.5
4.8
3.2
95% CI
2.4-6.6
3.8-5.4
3.8-9.2
3.5-4.4
4.2-5.9
2.4-4.9
4.1-5.6
0-2.6
4.3-5.8
2.0-3.5
4.1-5.6
0.9-3.5
3.9-5.4
0-3.8
4.1-5.6
2.4-4.1
P* HR 0.356------
Univariate analysis
Multivariate analysis LCI UCI P
P
<0.001
0.003
- - 98.8%
---
--
- --0.001-
1.8 1.3 2.6 1.9 1.3 2.7
--- -
0.025 0.700 - - - - - - ---
- - - --
- - 99.5%
<0.0001 <0.0001 <0.001
<0.0001 <0.001 0.005
- - - <0.0001 -
4.0 2.2 7.5 4.9 2.5 9.8
0.015 0.420
0.029 0.812
- -- 0.030 --- 73.3% 1.7 1.1 2.8 1.8 1.1 3
- -- 0.004 --- 91.1% 2.8 1.4 5.6 3.4 1.6 7.3
---- - --- --- - -- ---- - --- --- - --
ATM mutated
y: year; P: P-value; P*: Bonferroni
correction; PFS: progression-free survival; CI: confidence interval; HR: hazard ratio; LCI: lower boundary of the confidence interval; UCI: upper boundary immunoglobulin heavy variable gene; nr: not reached.
of the confidence interval; IGHV:
AB
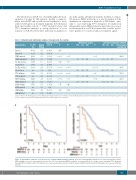
Figure 6. Kaplan-Meier estimates of progression-free survival in BIRC3-mutated patients. (A) Cases harboring BIRC3 mutations are represented by the red line. BIRC3-wildtype cases are represented by the blue line. (B) Cases harboring BIRC3 mutations are represented by the red line. Cases harboring TP53 disruption (including TP53 mutation and/or 17p deletion) are represented by the yellow line. Patients devoid of BIRC3 mutation and TP53 disruption are represented by the blue line.
haematologica | 2020; 105(2)
455
