
Page 196 - 2020_02-Haematologica-web
P. 196
J.S. Vermaat et al.
95%-CI 1.00-2.14). Employing competing risk analysis, MYD88-mutated DLBCL revealed significantly higher relapse rates (46.6%, 95%-CI 35.1-58.1) than cases with wild-type MYD88 (33.3%, 95%-CI 26.2-40.4)(Gray’s; P=0.029; CSH 1.62, 95%-CI 1.06-2.48), while non-relapse mortality showed no significant difference (Gray’s; P=0.832). Mutated CD79B showed higher cumulative incidence for relapse/progression (56.3%, 95%-CI 37.9- 74.8) versus wild-type CD79B (35.1%, 95%-CI 28.5- 41.8)(Gray’s; P=0.019, CSH: 1.82, 95%-CI 1.06-3.14), whereas no significant difference was found for OS (HR 1.43, 95%-CI 0.81-2.53).
Despite relatively high HR, none of the other molecular aberrations was a significantly adverse prognostic factor for OS (Table 3), which can be explained by the lack of power due to the low incidence of these aberrations. For these molecular data, univariate cause-specific hazards for relapse/progression showed similar results. The nine HGBL had an OS of 50.0% (95%-CI 24.1-100) compared to 63.6% (95%-CI 57.3-70.6) (log-rank; P=0.628) for non- HGBL.
Prognostic significance of MYD88 mutations in multivariable analysis
To evaluate the prognostic impact of mutated MYD88 on survival outcomes in addition to other molecular aber- rations and the IPI, the initial multivariable Cox regression model included the standard individual IPI risk factors (Model 1, Table 3A/3B). In the second model, the current WHO 2016 molecular aberrations (EBV and oncogenic rearrangements) were added. In the third model, also MYD88 and CD79B mutations were included. MYD88 mutations showed prognostic significance for OS (HR 1.87, 95%-CI 1.10-3.20) in addition to ECOG-PS (≥2) (HR 8.16, 95%-CI 4.90-13.59) and Ann Arbor stage (III/IV) (HR 1.84, 95%-CI 1.04-3.25). In this third model, oncogenic rearrangements, mutated CD79B, elevated LDH, and age (>65 years) did not have a significant impact. The per- formance of the IPI prognostic model was improved by adding all molecular aberrations and mutated MYD88 and CD79B as risk factors, as indicated by an increase in cross- validated C-index (CVC) from 0.67 to 0.70. MYD88 did not have a significant impact on the cause-specific survival
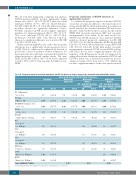
Table 3B. Prognostic impact of molecular aberrations and IPI risk factors on relapse/progression: univariable and multivariable analysis.
ì
IPI: >2 Extranodal Yes (vs. No)
IPI: Stage
III/IV (vs. I/II)
IPI: ECOG Performance Score
>2 (vs. <1) IPI: Age
>60 (vs. <60) IPI: LDH
>Upper limit (vs. Normal) MYC
Rearranged
(vs. Wildtype) BCL2
Rearranged
(vs. Wildtype) BCL6
Rearranged
(vs. Wildtype) EBV Status
Positive (vs. Negative) CD79B
Mutated (vs. Wildtype) MYD88
Mutated (vs. Wildtype) Cross-validated C-index
Cause-specific hazards (CSH) for relapse/progression
Univariable
HR 95%-CI HR
1.57 0.99-2.41 1.55
2.76 1.63-4.68 2.12 4.48 2.58-7.78 4.48 1.14 0.75-1.74 1.11 0.98 0.64-1.50 0.77
1.63 0.86-3.09 1.34 0.75-2.40
1.01 0.57-1.78 0.79 0.36-1.71 1.82 1.06-3.13 1.62 1.06-2.48
95%-CI
HR
95%-CI
HR
95%-CI
1.14-2.86
1.19-3.82 2.57-8.22 0.71-1.77 0.51-1.31
0.96-3.77 0.66-2.30
0.49-1.68
0.34-1.86
0.64-2.36
0.85-2.37
0.64
Multivariable Model 1 IPI
Multivariable
Model 2
(IPI + molecular aberrations WHO 2016)
Multivariable
Model 3
(IPI + molecular aberrations WHO 2016 + MYD88 + CD79B)
0.99-2.41 1.63 1.22-3.67 2.06 2.58-7.78 5.09 0.71-1.72 1.14 0.49-1.21 0.77
1.84 1.03
0.89 0.66
1.04-2.57 1.81 1.17-3.63 2.14 2.86-9.05 4.60
0.73-1.79 0.48-1.22
0.94-3.49 0.56-1.90
0.49-1.59 0.29-1.49
1.12 0.82
1.90 1.23
0.91 0.79 1.23 1.42
0.63
0.63
For the multivariable model, unknown was regarded as a separate group (not reported).
430
haematologica | 2020; 105(2)
