
Page 177 - 2020_02-Haematologica-web
P. 177
HLA-matched unrelated or haploidentical donor
Treatment failure
There were no differences in treatment failure by donor type (Table 2 and Figure 1B). Independent of donor type, treatment failure was higher in patients with HCT-CI score of ≥3 (HR 1.28, 95%CI: 1.06-1.53; P=0.009) and those with poor cytogenetic risk (HR 1.56, 95%CI: 1.27- 1.90; P<0.001). Donor age was not associated with treat- ment failure (HR 0.99, 95%CI: 0.98-1.01; P=0.8). In a sub- set analysis limited to transplantation in CR1, there were no differences in treatment failure by donor type (HR 1.22, 95%CI: 0.95-1.56; P=0.1).
Non-relapse mortality and relapse
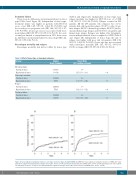
Non-relapse mortality risk did not differ by donor type
Table 2. Effect of donor type on transplant outcomes.
(Table 2 and Figure 2A). Independent of donor type, non- relapse mortality was higher for HCT-CI score of >3 (HR 1.40, 95%CI: 1.03-1.90; P=0.03). Relapse occurred in 299 patients. Of the 299 patients who relapsed, two (<1%) patients had only molecular relapse, 80 (27%) only cytoge- netic relapse, 56 (19%) hematologic relapse, 59 (20%) molec- ular and hematologic relapse, and 102 (34%) cytogenetic and hematologic relapse. Relapse was higher after transplanta- tion from haploidentical donors compared to MUD (Table 2 and Figure 2B). Independent of donor type, the risk of relapse was higher with poor risk cytogenetics (HR 1.82, 95%CI: 1.43-2.33; P<0.001). Donor age was not associated with non-relapse mortality (HR 1.01, 95%CI: 0.98-1.03; P=0.5) or relapse (HR 0.99, 95%CI: 0.98-1.01; P=0.4).
Hazard Ratio P (95% confidence interval)
1.00
1.27 (1.01 – 1.60) 0.04
1.00
1.01 (0.70 – 1.46) 0.9
1.00
1.32 (1.01 – 1.72) 0.04
1.00
1.19 (0.96 – 1.49) 0.1
Outcome
Overall mortality Unrelated donor Haploidentical donor
Non-relapse mortality
Unrelated donor
Haploidentical donor Relapse
Unrelated donor
Haploidentical donor
Treatment failure
Unrelated donor
Haploidentical donor
Number Events/Evaluable
316/631 100/192
135/624
36/191
224/624 75/191
359/624
111/191
AB
Figure 2. 5-year adjusted cumulative incidences of relapse and non-relapse mortality (NRM). (A) NRM: the 5-year adjusted cumulative incidence of NRM after trans- plantation of grafts from haploidentical (Haplo) donor (28%, 95%CI: 19-38) and matched unrelated donor (MUD) (28%, 95%CI: 19-38). (B) Relapse: the 5-year adjust- ed cumulative incidence of relapse after transplantation of grafts from Haplo donor (48%, 95%CI: 39-56) and MUD (41%, 95%CI: 36-45).
haematologica | 2020; 105(2)
411
