
Page 166 - 2020_02-Haematologica-web
P. 166
C. Talati et al.
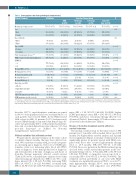
Table 1. Demographics and clinicopathological characteristics.
Clinical Parameter
Median age (range), years
Sex
Male
Female Race/ethnicity
Other
White
Type of AML
De novo
Secondary
Prior hematologic disease**
HMA for prior hematology malignancy ECOG PS
0-1
2-4
Median WBC, ×109/L Median platelet, ×109/L Median hemoglobin, g/dL Median PB blasts, % Median BM blasts, % Karyotype (n=874)
Adverse Diploid/intermediate Favorable
FLT3-ITD mutation (n=328 tested)
NPM1 mutation (n=320 tested)
All Patients
75.6 (70-95.7)
650 (66.3%)
330 (33.7%)
75 (7.7%) 905 (92.3%)
422 (43.1%)
558 (56.9%) 507 (51.7%) 264 (52.1%)
777 (79.3%) 186 (19%) 3.3 (0.2-230.7) 51 (1-996) 9.4 (4.8-15.2) 14 (1-99) 35 (2-98)
304 (31%) 554 (56.5%) 16 (1.6%) 36 (11%)
39 (12.2%)
HMA (n=255)
76.5 (70.1-95.2)
162 (63.5%)
93 (36.5%)
22 (8.6%) 233 (91.4%)
123 (48.2%)
132 (51.8%) 110 (43.1%) 31 (28.2%)
212 (83.1%) 42 (16.5%) 2.5 (0.2-147.8) 69 (1-743) 9.5 (5-15.2) 10 (1-93) 30 (4-94)
85 (33.3%) 147 (57.6%) 3 (1.2%) 10 (8.7%)
10 (8.8%)
Front-line Therapy Group
P
<0.0001
0.18
0.63
<0.0001
<0.0001 <0.0001 <0.0001
<0.0001 <0.0001 0.073 <0.0001 <0.0001 <0.0001
0.019
0.080
HI Therapy (n=360)
73.9 (70-89.8)
247 (68.6%)
113 (31.4%)
28 (7.8%) 332 (92.2%)
193 (53.6%)
167 (46.4%) 153 (42.5%) 82 (53.6%)
303 (84.2%) 46 (12.8%) 5.3 (0.2-230.7) 50.5 (2-996) 9.3 (4.8-14.5) 21 (1-98) 45.5 (2-98)
80 (22.2%) 234 (65%) 11 (3.1%) 23 (16.9%)
23 (18%)
LI Therapy (n=91)
77.9 (70.5-90.4)
67 (73.6%)
24 (26.4%)
4 (4.4%) 87 (95.6%)
22 (24.2%)
69 (75.8%) 66 (72.5%) 46 (69.7%)
78 (85.7%)
11 (12.1%) 3 (0.6-215.3) 50 (1-274) 9.6 (6.9-13.9) 8 (1-99) 33.5 (9-91)
36 (39.6%) 47 (51.6%) 0 (0%) 0 (0%) 2 (9.1%)
Supportive Care (n=274)
77 (70-95.7)
174 (63.5%)
100 (36.5%)
21 (7.7%) 253 (92.3%)
84 (30.7%)
190 (69.3%) 178 (65%) 105 (59%)
184 (67.2%) 87 (31.8%) 3.4 (0.6-215.7) 39 (4-485) 9.3 (4.8-14.7) 13 (1-96) 30 (16-94)
103 (37.6%) 126 (46%) 2 (0.7%) 3 (5.4%) 4 (7.1%)
*P-value was computed by χ2 test or Kruskall-Wallis test. **Myelodysplastic syndrome accounted for >97% of all prior hematologic malignancies; others included myelofibro- sis,polycythemia vera,and essential thrombocytosis.AML:acute myeloid leukemia;BM:bone marrow;ECOG PS:Eastern Cooperative Oncology Group Performance Status;HI: high intensity; HMA: hypomethylating agent; LI: low intensity; PB: peripheral blood; WBC: white blood cell.
disorders (51.7%), myelodysplastic syndrome accounted for 93.9% of the population and over one-third (36.5%) of such patients had received HMA. In the HMA-treated AML cohort (n = 255), 31 patients (12.1%) had previously received HMA therapy for an antecedent hematologic dis- order. Cytogenetically, 56.5% of the patients had interme- diate-risk or normal diploid karyotype whereas 31% had poor-risk karyotype as defined by National Comprehensive Cancer Network.18
Clinical variables that affected survival
We performed a univariate analysis on the entire cohort to identify clinical variables that may have affected sur- vival. We found that secondary AML, poor-risk cytogenet- ics, increasing age at diagnosis, CCI score ≥ 3, ECOG per- formance status ≥ 2, increasing white blood cell (WBC) count at diagnosis, lower hemoglobin level at diagnosis, and lower platelets at the time of diagnosis, and choice of front-line therapy negatively affected overall survival (Table 2). However, our multivariate analysis showed that only increasing age [hazard ratio (HR) = 1.14, 95% confi- dence interval (CI): 1.05-1.23; P=0.002], increasing WBC (HR 1.19, 95%CI: 1.13-1.25; P<0.0001), secondary AML (HR = 1.44, 95%CI: 1.23-1.68; P<0.0001), poor-risk cytoge-
netics (HR = 1.92, 95%CI: 1.64-2.25; P<0.0001), higher ECOG performance status (HR = 1.80, 95%CI: 1.48-2.18; P<0.0001), and choice of front-line therapy affected over- all survival (Table 3). Interestingly, CCI did not affect over- all survival in the multivariate analysis.
Choice of front-line treatment and its effect on survivaloutcomes
The median overall survival for the entire cohort of 980 patients was 7.1 months, with a median follow up of 20.5 months. Per Kaplan-Meier survival analysis and log-rank test for significance (Figure 1), median overall survival was significantly greater for patients treated with HMA com- pared with those who received high-intensity therapy (14.4 vs. 10.8 months; HR=1.35, 95%CI: 1.10-1.65; P=0.004). Moreover, patients in the HMA treatment group also had better overall survival than patients in the low- intensity therapy (14.4 vs. 5.9 months, HR = 2.01, 95%CI: 1.53-2.62; P<0.0001) or supportive care groups (14.4 vs. 2.1 months, HR = 2.94, 95%CI: 2.39-3.61; P<0.0001). The estimated survival probability at one year with HMA treatment was significantly greater at 55.4% versus 42.7% with high-intensity therapy, 25.3% with low-intensity therapy, and 14.2% with supportive care (P<0.0001).
400
haematologica | 2020; 105(2)
