
Page 111 - 2020_02-Haematologica-web
P. 111
Phenotypic markers for hereditary spherocytosis
changes in gross morphology toward a spherocytic form (Online Supplementary Figure S3), as well as a higher num- ber of microcytes, as determined by quantitative digital microscopy (Online Supplementary Figure S4).
Red blood cell heterogeneity and deformability as a marker of clinical severity
Another parameter we found to reflect disease severity in HS is RBC heterogeneity. Increases in RDW, RDW/hemoglobin and MCHC/RDW ratios were suggest- ed to be markers of the clinical severity of HS.35 We also found in our study that RDW correlates with HS severity
(Figure 3B). However, since absolute RDW values are known to vary between laboratories and depend on the age and physical activity of the subjects,4 we also used microscopy, confirming that patients with severe HS did indeed have a broader range of RBC shapes and MPA DW (Figure 4J, Online Supplementary Figure S3).
Word of caution regarding automated detection of hematocrit and mean corpuscular hemoglobin concentration in patients with hereditary spherocytosis
MCHC was previously suggested to be prognostic for the severity of HS in non-splenectomized patients.9,11 We
ABCD
EFGHI
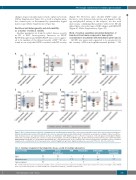
Figure 5. Role of splenectomy on red blood cell parameters in hereditary spherocytosis. Blue circles represent healthy controls, black circles represent (unsplenec- tomized) hereditary spherocytosis (HS) patients and red circles represent splenectomized HS patients. HS patients are grouped according to clinical severity (i.e. mild, moderate/severe and splenectomized). (A) Red cell distribution width (RDW (percent coefficient of variation, %CV), (B) glycated hemoglobin (HbA1c) (mmol/mol), (C) band 4.1a/4.1b ratio, (D) mean corpuscular hemoglobin concentration (MCHC) (g/L), (E) intracellular potassium (mmol/L), (F) eosin-5′-maleimide (EMA)-binding hemoglobin (%), (G) maximum deformability (EImax), (H) hydration state of the red blood cells reflected by hypertonic osmolarity at 50% of maximal elongation (Ohyper) (mOsmol/L), (I) 50% lysis point in the osmotic fragility test (g/L NaCl). Significant differences are noted: *P≤0.05, †P≤0.01 or ‡P≤0.001.
Table 2. Summary of parameters that characterize disease severity in hereditary spherocytosis.
Disease Severity
Mild
Moderate/severe
Splenectomized
MCHC Density RDW Reticulocytes Deformability Membrane loss (Percoll, Ohyper) (Elmax) (vesiculation)
↑↑ ↑↑ = ↑ ↓ ↑ ↑ ↑ ↑↑ ↑↑ ↓↓ ↑↑
↑↑ = = ↑ = =
The ↑ symbol indicates increased compared to healthy controls, ↓ indicates decreased compared to healthy controls and = indicates the same as in healthy controls. MCHC: mean corpuscular hemoglobin concentration; RDW: red cell distribution width; EImax: maximal elongation index,
haematologica | 2020; 105(2)
345
