
Page 121 - 2019_12-Haematologica-web
P. 121
MDM2 inhibition in chronic lymphocytic leukemia
apoptosis associated with CLL cells and induced their pro- liferation. Importantly, RG7388 abrogated the protection induced by CD40L/IL4 and inhibited proliferation of stim- ulated CLL cells (Online Supplementary Figure S4A). Proliferating CLL cells cultured on the CD40L-expressing layer for 96 h were exposed to RG7388 and cell counting 48 h after exposure revealed a concentration-dependent suppression of cell growth with half maximal growth inhibitory (GI50) values in the nanomolar range (Online Supplementary Figure S4B, C). Furthermore, p53 stabiliza- tion and induction of p53 targets were much more pro- nounced in stimulated CLL cells than in their unstimulated counterparts, suggesting that p53 anti-tumor activity can be rescued even in CLL cells protected by their microenvi- ronment (Online Supplementary Figure S4D, E). Interestingly, it was found that the upregulation of CDKN1A and MDM2 was greater in stimulated CLL cells than in unstimulated ones, whereas the induction of PUMA was lower in the stimulated CLL cells (Online Supplementary Figure S4F), and there was no induction of cleaved PARP (Online Supplementary Figure S4D, E), sug- gesting that RG7388 may elicit a preferential growth- arrest rather than apoptosis in CD40L/IL4-stimulated CLL cells and that it can disrupt the signaling from the microenvironment that leads to in vivo CLL cell prolifera- tion.
RG7388 induces apoptosis in p53-functional chronic lymphocytic leukemia
To further investigate the mechanism of RG7388 cyto- toxicity, induction of apoptosis was assessed by measur-
ing caspase 3/7 activity and cleaved PARP expression. At 24 h, RG7388 increased caspase 3/7 activity in p53-func- tional cells (Figure 6A), whereas no increase in caspase 3/7 activity was observed in p53-non-functional CLL samples (Figure 6B). To corroborate this, we also measured cleaved PARP expression by western blot and found that RG7388 increased expression of the 89 kDa cleaved PARP isoform in p53-functional CLL samples (Figure 6C) but not in p53- non-functional samples (Figure 6D).
Gene expression signature and response to RG7388 in normal cells and chronic lymphocytic leukemia cells are markedly distinct
One concern about the use of p53-reactivating therapies is their effect on normal cells. It has been suggested that MDM2 inhibitors might activate different cellular responses in normal and tumor cells.38-41 To investigate this specifically and in more mechanistic detail in the context of CLL, we tested the effect of RG7388 on normal cells implicated in the dose-limiting hematologic toxicity of MDM2 inhibitors. We isolated PBMC, BMMC and CD34+ cells from healthy donors and analyzed the transcriptional profile of p53-target genes and the cytotoxic response to RG7388.
As expected, p53 transcriptional targets were induced by RG7388 in all normal cell types. However, in contrast to p53-functional CLL cells, which displayed a strong pro- apoptotic gene signature (Figure 2), MDM2 inhibition led to a significant and preferential upregulation of MDM2 in PBMC (Figure 7A), BMMC (Figure 7B) and CD34+ cells (Figure 7C).
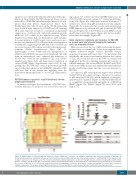
AB
C
Figure 4. RNA profiling of p53-transcriptional targets in chronic lymphocytic leukemia cells identifies subgroups with different sensitivity to RG7388. (A) Unsupervised hierarchical clustering and heat-map of p53 functional chronic lymphocytic leukemia (CLL) samples exposed to 1 μM RG7388 for 6 h, based on fold- change in expression of an 11-gene panel. The 11 selected p53-transcriptional target genes are listed on the right. Group A, columns 1-4; group B, columns 13-25; group C, columns 5-12. (B) Groups (Gp) of CLL patients’ samples identified by the hierarchical clustering analysis compared based on the median lethal concentration (LC50) values of RG7388. *P<0.01 (C) Group comparison performed using analysis of variance by parametric analysis and applying the Holm-Sidak correction for multiple comparisons. This analysis showed significant differences in mean RG7388 LC50 values between groups A and B and between groups A and C.
haematologica | 2019; 104(12)
2435
