
Page 196 - 2019_11 Resto del Mondo-web
P. 196
S.F. Fustolo-Gunnink et al.
ing study for neonates with and without major bleeding are reported in Online Supplementary Figure S3.
Major bleeds
A total of 71 (11%) major bleeds occurred, of which 55 were intraventricular hemorrhages and other intracerebral hemorrhages, 12 were pulmonary hemorrhages and four were gastrointestinal hemorrhages (Table 2). The major bleeds occurred at a median of 1 day (interquartile range, 1-4) after the onset of severe thrombocytopenia. At the end of the 10-day follow-up period, 73 patients (11%) had died, 63 (10%) had developed major bleeding and 93 (15%) had been discharged or transferred (Figure 2). Of the 93 discharged neonates, 76 (82%) were discharged to a stepdown unit. Ninety-one percent of the neonates underwent at least one ultrasound scan, with a mean of two scans during the 10-day follow-up period. In four neonates, major intracranial hemorrhage was already diagnosed on the first ultrasound scan after birth, on the first day of life.
Model development
The model contained 12 variables: all seven selected variables, plus the interaction term between platelet count and transfusion, plus interactions between time and IUGR and time and platelet count (both linear and quadratic). Platelet count was converted to a log-scale. The number of major bleeds included in the model was 63, because eight bleeds occurred more than 10 days after T0 (Table 2).
Final model
The median c-index of the final model was 0.74 (interquartile range, 0.69 - 0.82) (Figure 3). This indicates good predictive performance. An example of a risk-esti- mation by the model is shown in Figure 4, a plot of bleed- ing risk of two neonates with distinct risk profiles. During study days 1-3, the predicted risk of major bleeding within the subsequent 3 days in child A is substantially higher than that in child B, indicating that the use of this predic- tion model during that time-period would have correctly identified child A as being at high risk of bleeding. This image also illustrates that bleeding risk can increase or decrease rapidly. Table 3 shows the details of the model. A hazard ratio >1 indicates that the increase of a risk fac-
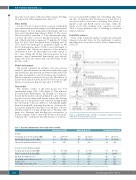
Table 1. Baseline characteristics of the study cohort (n=640).
Total cohort (n=640)
tor is associated with a higher risk of bleeding, and a haz- ard ratio <1 indicates that the increase of a risk factor is associated with a lower risk of bleeding. The effects of platelet count and IUGR varied over time, while the effects of all other variables were constant over time. Table 4 shows predicted risks of bleeding for different clinical scenarios.
Sensitivity analyses
None of the sensitivity analyses resulted in substantial changes in hazard ratios for the individual covariates, indicating that our model is robust (Online Supplementary Table S3).
Figure 1. CONSORT flow chart. CONSORT: consolidated standards of reporting trials; NICU: neonatal intensive care unit.
At birth
Gestational age in weeks: median (IQR)1
Birth weight in grams: median (IQR)
Intrauterine growth retardation, n (%)
At onset of severe thrombocytopenia
Postnatal age in days: median (IQR)
Platelet count x109/L, median (IQR)
Mechanical ventilation, n (%)
Necrotizing enterocolitis/sepsis, n (%) Sepsis, n (%)
Necrotizing enterocolitis, n (%)
28.1 (26.4-30.4)
900 (710-1180)
206 (32)
3.9 (1.6-9.25)
38 (29-45)
329 (51)
330 (52) 293 (46) 73 (11)
Major bleed (n=71)
27.7 (26.1-29.1)
945 (760-1200)
No major bleed (n=569)
28.1 (26.4-30.6)
900 (705-1178)
192 (34)
4.1 (1.8-9.8)
38 (28-45)
280 (49)
291 (51) 256 (45) 68 (12)
14
2.6
39
49
39 37 5
(20)
(1.0-6.8)
(31-44)
(69)
(55) (52) (7)
IQR: interquartile range. 1In five cases the exact gestational age could not be determined due to uncontrolled pregnancies. It was estimated in full weeks.
2302
haematologica | 2019; 104(11)
