
Page 105 - 2019_11 Resto del Mondo-web
P. 105
Sustained MR4 and molecular monitoring in CML
Table 2. Univariate and multivariate analysis of factors possibly associated with MR3 loss.
Factor n
Gender
Male 224 Female 226
Age at diagnosis
Probability of P Multivariate analysis P MR3lossat5yrs% HR(95%CI)
<45yrs 225
(95% CI)
5.9 (3.4-10.2) 0.34 9 (5.6-14.3)
9.1 (5.6-14.4) 0.84
5.8 (3.3-10.1)
8 (4.8-13.1) 0.65 6.3 (3.5-11.1)
10.5 (6.2-17.3) 0.05
5.9 (3.6-9.6)
3.6 (1.2-10.3) 0.03 8.6 (5.8-12.5)
≥45yrs 225 Transcript type
e14a2 222
e13a2 or e14a2\e13a2 209
History of TKI resistance before MR3
Yes 150
No 300 Time to MR3 achievement
< 7.7 months (1st q) 112 ≥ 7.7 months 338
MR4 achieved
Yes 324
No 126 >1st TKI line at MR3
Yes 114
No 336
1GTKI at MR3
Yes 295
No 155
2.6 (1.2-5.4)
25.4 (16.7-37.7)
5.8 (2.2-14.3) 0.62 8.1 (5.5-11.8)
7.7 (5-11.7) 0.83
7.6 (3.7-15)
<0.001 1.00
4.21 (2-8.5)*
<0.001
n: number; yrs: years; CI: confidence interval; HR: hazard ratio; TKI: tyrosine kinase inhibitor; q: quartile; 1GTKI: 1st generation TKI. *Achievement of MR4 was modelled in a time- dependent fashion.
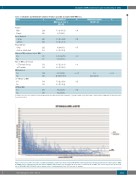
Figure 3. A total of 3,305 consecutive real-time quantitative polymerase chain reaction (RT-qPCR) results in patients achieving sustained molecular response (MR)- 4 (sMR4) and on standard dose tyrosine kinase inhibitor (TKI) (n=107). The starting point is the date of achievement of sMR3. The red line depicts the linear trend- line of BCR-ABL1/ABL1 RT-qPCR values (expressed in % on International Scale, IS) over time. n: number.
haematologica | 2019; 104(11)
2211
