
Page 60 - 2019_10 resto del Mondo_web
P. 60
A. Gao et al.
ABC
DE
F
GH
1956
haematologica | 2019; 104(10)
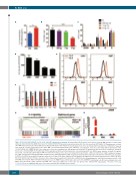
Figure 4. Elevated interleukin-4 level in acute myeloid leukemia bone marrow. (A) Interleukin-4 (IL-4) protein levels in bone marrow (BM) plasma of control (Ctrl) and acute myeloid leukemia (AML) mice based on enzyme-linked immunosorbent assay measurements. Five mice per group. (B) Number of megakaryocyte colonies (CFU-MK) formed from 5x10⁴ whole BM cells incubated with mIL-4 at the indicated concentrations. Four mice, two independent experiments. (C) Number of myeloid and erythroid colonies formed from 1x10⁴ whole BM cells incubated with mIL-4 at the indicated concentrations. Four mice, two independent experiments. CFC: colony-forming cells; GEMM: granulocyte, erythrocyte, monocyte, megakaryocyte; GM: granulocyte monocyte; G: granulocyte; M: monocyte; E: erythrocyte. (D) Mean fluorescence intensity (MFI) of phosphorylated Stat6 (pStat6) in FACS-sorted hematopoietic stem and progenitor cells (HSPC) upon exposure to mIL-4 (10 ng/mL) for 20 min, calculated by subtracting the MFI of non-treated controls. Three mice, two independent experiments. LKS: Lin-/c-Kit+/Sca-1+; MPP: multipotent progen- itor, CMP: common myeloid progenitor; MEP, megakaryocyte-erythroid progenitor; MkP: megakaryocyte progenitors. (E) Representative flow cytometric plots of pStat6 in FACS-sorted HSPC upon mIL-4 (10 ng/mL) exposure for 20 min. (F) Relative expression of megakaryocyte (MK)-associated transcription factors in LKS+ cells upon mIL-4 (10 ng/mL) exposure for 24 h. Four mice, three independent experiments. (G) Positive enrichment of IL-4 signaling genes and Stat6-bound genes in LKS+ cells from AML bone marrow. NES: normalized enrichment score; P, FWER P-value. (H) Relative expression of IL-4 mRNA in endothelial cells (EC), mesenchymal stem cells (MSC) and osteoblasts (OBC) isolated from AML and control mice BM. Four or five mice per group, three independent experiments. *P<0.05, **P<0.01, ***P<0.001. ns, no significant difference. Error bars represent the standard error of mean.
