
Page 139 - 2019_10 resto del Mondo_web
P. 139
Meta-analysis of the impact of MRD in adult B-ALL
effect is retained within each of the subgroups.28 The haz- ard ratio effect size appears slightly larger than in our meta-analysis, which could reflect differences in the stud- ies included or the different analysis approach that was used (with a Bayesian rather than a random effects model). There was only partial overlap in studies between the two meta-analyses, with five studies included in both,20,33,46–48 meaning that our study adds 18 studies and 2,245 patients to the combined evidence base. Only one of the adult studies in the analysis by Berry et al. was identi- fied as concerning B-ALL,48 but our efforts to extract data from the B-ALL populations wherever possible allowed us to conduct subgroup analyses specific for this phenotype with 19 studies of RFS and 12 studies of OS. Similarly, we calculated outcomes according to Ph status for a larger number of studies (20 vs. 8 in Berry et al.), enabling a more robust subgroup analysis and allowing further subgroup analyses to be conducted within each cytogenetic catego- ry. The lack of overlap between the two meta-analyses was likely due to differences in eligibility criteria: our study allowed for a larger range of methods to calculate hazard ratios (as described in Tierney et al.30), only exclud- ing studies with small patient numbers if MRD was exam- ined retrospectively, and included congress abstracts. Our study focused on a narrower population than that of Berry et al., but a high degree of heterogeneity remained; this highlights the limitations of conducting meta-analyses according to MRD status and should encourage future research using pooled analysis of patient-level data.
In general, MRD evaluations are conducted in two dif- ferent scenarios. The first is in patients who achieve mor-
phological remission after receiving induction therapy, at the time of remission evaluation or shortly after, to evalu- ate the quality of the response. The second scenario is to use MRD monitoring as a predictor for pending relapse. We examined subgroups according to the timing of MRD assessment, either before or after 3 months from starting induction, or before or after HSCT. MRD assessments up to 3 months from induction were generally taken during or at the end of induction treatment – i.e. before consoli- dation or intensification therapy – and this subgroup therefore falls into the first scenario. In our analysis, there was little difference in the relative effect of MRD assessed at 3 months or later, and four studies that evaluated out- comes from multiple MRD timepoints showed a benefi- cial effect of MRD negativity at both earlier and later time- points. Furthermore, subgroup analysis of RFS according to the timing of MRD assessment showed that there was no difference in RFS improvement for patients who achieved MRD negativity at early timepoints compared to those who achieved it at later timepoints. Measurement of MRD after HSCT may also fall into the second scenario, and the apparently large impact of MRD on RFS and OS in the post-HSCT subgroup may reflect the strong predic- tive ability of MRD to detect relapse in this setting.
Nevertheless, the timing of MRD measurement is an important consideration if the technique is to be used to support treatment decisions, and evidence exists to sup- port early MRD testing. For example, in a study conducted in the USA that enrolled patients with Ph-negative B-ALL or T-ALL, MRD levels as early as 28 days following the initiation of induction therapy were used to predict out-
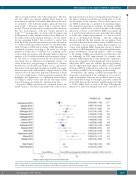
Figure 4. Forest plot of overall survival hazard ratios for all studies included in the primary analysis. CI: confidence interval; HR: hazard ratio; MRD: minimal residual disease; MRD neg: minimal residual disease-negative status; MRD pos: minimal residual disease-positive status.
haematologica | 2019; 104(10)
2035
