
Page 141 - 2019_09-HaematologicaMondo-web
P. 141
Effects of PEG-asparaginase on CSF asparagine levels
that serum asparagine levels of patients enrolled in this pharmacological study were continuously depleted for at least 14 days after each PEG-asparaginase dose in the majority of the patients.
In our study when CSF asparagine levels were evaluated in relationship to serum asparaginase activity levels, a con- siderable number of samples was found not to have levels below the LLOQ. In patients with serum asparaginase activity levels below 100 IU/L (which is considered insuf- ficient to consistently obtain complete asparagine deple- tion in serum) only 6.5% of the corresponding CSF sam- ples had levels below the LLOQ. When the level of asparaginase activity was 100 IU/L or higher, 70% of the samples had asparagine levels higher than 0.2 μmol/L (i.e. higher than the LLOQ). Furthermore, at serum asparagi- nase activity levels of 100 IU/L or higher – including sam- ples with activity levels greater than 1500 IU/L - only about one third of the corresponding CSF samples had asparagine levels below the LLOQ.
Some studies have been conducted in the past on aspects related to CSF asparagine depletion along with administration of different asparaginase products. Dibenedetto et al. evaluated CSF asparagine levels 3 days after the administration of the fourth dose of ERW-
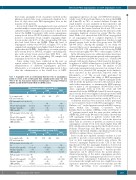
Table 5. Asparagine levels in cerebrospinal fluid by levels of asparaginase activity in serum, at the cerebrospinal fluid sampling points (days +33 and +45) in the (A) Associazione Italiana di Ematologia e Oncologia Pediatrica (AIEOP) and (B) Berlin-Frankfurt-Münster (BFM) cohorts.
asparaginase (given at a dosage of 10,000 IU/m2 intramus- cularly every 72 h) and found them to be below the LLOQ (≤0.2 μmol/L) in 75% of treated children. Despite the small number of cases analyzed in that experience and based on the fact that asparaginase is believed not to be able to cross the barrier between blood and CSF, it was concluded that this phenomenon was the reflection of the asparagine depletion observed in serum.7 On the other hand, Ahlke et al. showed that 2,500 IU/m2 un-pegylated E. coli asparaginase led to complete depletion of CSF asparagine 2 or 3 days after application. Median trough plasma activity levels in this dose-group were 106 IU/L (26-349 IU/L).29 Among the findings of our study, we observed that even at asparaginase activity levels greater than 1500 IU/L CSF asparagine levels below the LLOQ were found in roughly 30 to 40% of the samples (Table 3).
In the following years, two additional studies investigat- ed this phenomenon in patients treated with asparaginase. The first, conducted in 1996 by Gentili et al.,5 evaluated 44 patients with newly diagnosed ALL treated in the induc- tion phase of a BFM-oriented protocol with 10,000 IU/m2 of ERW-asparaginase every 3 days. The analysis of CSF and serum asparagine levels, measured on average 3 days after each dose, revealed CSF asparagine levels similar to those reported in the previously reported study by Dibenedetto et al.7 The second study, performed by Rizzari et al.,6 compared the ability of ERW-asparaginase and native E. coli asparaginase to deplete asparagine in the CSF. In all the 62 patients treated in the induction phase with either intravenous or intramuscular ERW-asparagi- nase or native E. coli asparaginase (10,000 IU/m2 every 3 days), asparagine levels in both the serum and CSF remained below the LLOQ (≤0.2 μmol/L) even if asparag- inase activity levels were higher in the group treated with E. coli asparaginase than in that treated with ERW-asparag- inase. Similar results were found in a study by Woo et al.8
A different trend has been found in studies performed so far in patients treated with PEG-asparaginase. Vieira Pinheiro et al.30 studied patients treated with PEG-asparag- inase within the German Cooperative Acute Lymphoblastic Leukemia (COALL) study and Rizzari et al.15 patients treated with the same product within the AIEOP ALL 2000 study. Overall, both studies showed that CSF asparagine levels in patients treated with PEG- asparaginase were undetectable (i.e., below the detection limit) only in a fraction of patients, no matter if serum asparaginase activity levels were much higher than 100 IU/L. Additional studies reported by the Nordic Society of Pediatric Hematology and Oncology and even more recently by the Dutch Childhood Leukemia Study Group
14,27,31,32 (DCLSG) confirmed these observations.
Based on the most updated scientific evidence it is not possible to provide a clear and incontrovertible explana- tion on how asparaginase products may achieve the observed asparagine depletion in the CSF. It has been hypothesized that the asparagine depletion observed in the CSF could result from a continuous balance between the serum and CSF asparagine pools.10,11 Another possible explanation can be inferred from the specific physico- chemical properties of the native asparaginase products compared to the PEG-asparaginase product. It is conceiv- able that native asparaginase formulations, given their lower molecular weight and steric size, might have some capacity to penetrate, even in very low amounts, into the CSF thus providing local asparaginase activity.
A
N. of samples with CSF and serum data
PEG-asparaginase activity in serum (IU/L) 0 <100 ≥100
Mean* (SD) (μmol/L) Median* (μmol/L) IQR (μmol/L)
B
N. of samples with CSF and serum data
2.4 (2.5) 1.44 0.53-2.76
1.0 (1.3) 0.60 0.22-1.30
1.2 (1.7) 0.61 0.3-1.4
Total N%N%N%
18 6.6
253 93.4 271
CSF asparagine levels at day +33
N. 5 193 198
Mean* (SD) (μmol/L) Median* (μmol/L) IQR (μmol/L)
5.9 (3.3) 6.59 4.85-7.65
0.4 (0.5) 0.31 0-0.71
0.6 (1.1) 0.32 0-0.76
CSF asparagine levels at day +45
N. 13 60 73
PEG-asparaginase activity in serum (IU/L) 0 <100 ≥10
Total N%N%N%
28 5.8
454 94.2 482
CSF asparagine levels at day +33
N. 6 370 376
Mean* (SD) (μmol/L) Median* (μmol/L) IQR (μmol/L)
1.50 (2.39) 0.68 0.37-0.91
0.54 (1.22) 0.38 0.01-0.79
0.56 (1.25) 0.38 001-0.79
CSF asparagine levels at day +45
N. 22 84 106
Mean* (SD) (μmol/L) Median* (μmol/L) IQR (μmol/L)
1.50 (1.27) 1.27 0.67-2.13
0.69 (0.60) 0.49 0.23-1.12
0.86 (0.84) 0.68 0.32-1.23
PEG: pegylated; CSF: cerebrospinal fluid; SD: standard deviation; IQR: interquartile range.
haematologica | 2019; 104(9)
1819
