
Page 123 - 2019_09-HaematologicaMondo-web
P. 123
Sequential therapy patients with refractory AML
first month after HCT) did not respond to treatment, whereas all other patients obtained complete remission. There were 12 cases of relapse. Relapse incidence at three months, one year, and three years post HCT were 6%, 20%, and 29%, respectively (Figure 2B). There were no cases of late relapses (occurring more than 3 years post HCT). Among the relapsing patients, eight (67%) had a baseline complex karyotype and four (33%) had FLT3-ITD with normal karyotype. There was no difference between the three protocols in terms of incidence of relapse. ATG also did not affect relapse incidence. Patients with baseline complex or monosomal karyotype had a higher risk for relapse (HR: 5.3, 95%CI: 1.6-17.9; P=0.008). Due to the low number of events, we did not perform a full regres- sion analysis for relapse.
Intervention at the time of relapse was donor lympho- cyte infusion (DLI) (n=5) and a second allogeneic HCT (n=1). Only the patient who had a second transplant sur- vived (73 months post HCT and still alive). Median time from relapse to death among all 11 patients was 1.9 months. Median time from relapse to death in patients given DLI (n=5) was 5.5 months.
Overall survival
At the time of data analyses, 23 patients were alive. Incidences of OS at three months, and one, three, and five years post HCT were 90% (95%CI: 84-96%), 71% (95%CI: 60-83%), 61% (95%CI: 54-69%), and 53% (95%CI: 41-66%), respectively (Figure 2C).
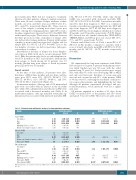
In univariate analyses, older age and a 9/10 mismatched graft were associated with an increase in the mortality rate, while ATG administration and chronic GvHD were associated with a decreased mortality rate (Table 2). In multivariate analysis, older age remained statistically sig- nificant and was associated with increased mortality (HR:
1.32, 95%CI: 1.09-1.71; P=0.046), while only chronic GvHD was associated with decreased mortality (HR: 0.397, 95%CI: 0.07-0.93; P=0.045). Survival was not influ- enced by time from diagnosis to HCT as a continuous variable, even when we segregated patients into HCT ≤60 days from diagnosis, HCT 61-120 days from diagnosis, and HCT ≥120 days from diagnosis (median not reached, 49 months, and 35 months, respectively; P=0.59) (Figure 2D). Survival was also similar between the TBI-FLAMSA, TREO-FLAMSA, and FITCy protocols (1-year OS, 69%, 71%, and 75%, respectively; P=0.91).
Patients with Duval score of 4 had a mean OS of 47 (95%CI: 12-82) months, compared to patients with a score of 2 and 3 who had a mean OS of 69 (95%CI: 47-91) months and 61 (95%CI: 44-78) months, respectively (P=0.055).
Discussion
We summarized the long-term experience with FLAM- SA-based protocols given to patients with primary refrac- tory AML. Median age was 54 years with the oldest patient being 72 years old. Early toxicities were accept- able, with only 4% of the cases developing SOS or ARDS and only one fatal event. Incidence of severe mucositis was rare and occurred in only 10% of the patients. NRM at 30 days was 6%, reflecting the feasibility of the proto- col even in older patients, and highlighting the fact that, although all patients experienced prolonged and pro- found neutropenia, severe infections were not a signifi- cant issue.
All patients engrafted at a median of 13 days. Acute GvHD occurred in 50% of the patients and 12% devel- oped grade 3-4 acute GvHD. These rates are quite accept-
Table 2. Univariate and multivariate analyses for transplantation outcomes.
Datum
Acute GvHD
Sex (male)
Age
ATG
Matching (9/10 vs. 10/10)
Donor sex (female to male vs. other)
Chronic GvHD Sex, male Age
ATG
Donor sex (female to male vs. other) Prior acute GvHD
Overall Mortality Sex (male)
Age
Time to HCT Conditioning type ATG
Matching (9/10 vs. 10/10) Prior acute GvHD
Prior chronic GvHD
Univariate analysis Multivariate analysis
HR 95%CI P HR 95%CI P
1.41 0.98 0.39 1.16 1.38
1.2 0.99 0.67 1.7 1.8
1.8
1.48
1.00 1.22 0.84 2.25 1.4 0.23
1.10-5.25 0.027 1.75 0.95-1.00 0.055 0.98 0.18-0.88 0.02 0.33
0.39-3.36 0.79 0.58-3.29 0.46
0.51-2.82 0.66
0.97-1.01 0.49
0.29-0.95 0.045 0.79
0.93-4.45 0.08
1.23-4.7 0.025 1.96
0.76-4.26 0.18
1.1-1.9 0.013 1.32
0.98-1.02 0.23 0.42-3.5 0.71
0.35-1.01 0.05 0.71 1.05-6.75 0.048 2.1
0.44-2.46 0.93
0.06-0.83 0.025 0.397
0.55-9.04 0.13
0.95-0.99 0.04 0.13-0.82 0.02
0.44-1.11 0.09
1.12-3.42 0.04
1.09-1.71
0.046
0.22-1.17 0.07 0.88-5.3 0.090
0.07-0.93
0.045
HR: Hazards Ratios; CI: Confidence Interval; GvHD: graft-versus-host disease; ATG: anti-thymocyte globulin; HCT: hematopoietic cell transplantation. Statistically significant factors in bold.
haematologica | 2019; 104(9)
1801
