
Page 107 - 2019_09-HaematologicaMondo-web
P. 107
Long-term outcome after transplant in MF patients
mortality of the matched population (Figure 2). Excess mortality in the younger cohort (<45 years) was 14% (8- 21%) and population mortality was 1% (1-1.1%) at this age. In contrast, excess mortality in the older cohort (≥65 years) was 33% (13-53%) and population mortality was 12% (10-14%).
Risk factors for late excess mortality
A Cox model was developed to estimate the risk fac- tors for excess mortality in the 2-year disease-free sur- vivors. Of note, the interpretation of the influence of vari- ables in this LM model applies to patients alive and free
of the disease two years following transplantation. For instance, patients with severe GvHD may not survive the second year post-transplant but the subset of patients who survived with severe GvHD are incorporated in the model. The multivariable model shows that older age, MF secondary to PV or ET, male gender recipient were risk factors for excess mortality (Table 4). In long-term survival, previous GvHD was protective for mortality (Table 4). The model highlights that age and sex, which were at higher risk in the general model, are still risk fac- tors for excess mortality. Figure 3 shows changes in the hazard of excess mortality of reference patients according
AB
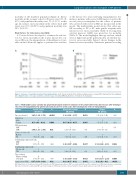
Figure 1. Outcome of myelofibrosis patient from landmark time. (Left) Overall survival (OS; solid line) and disease-free survival (DFS: dashed line) from landmark time. (Right) Incidence of relapse (solid line) and non-relapse mortality (NRM) (dashed line). N: number; Tx: transplant.
Table 3. Multivariable (cause-specific) Cox proportional hazards models for outcomes in the period between two and ten years after hematopoi- etic stem cell transplantation for patients alive and disease-free at two years after hematopoietic stem cell transplantation.
Variables Overall survival P HR (95%CI)
Age (per decade) 1.45 (1.19 - 1.76) <0.001
Disease-free survival HR (95%CI)
1.18 (1.01 - 1.37)
P
0.033
0.003
Relapse HR (95%CI)
1.16 (0.96 - 1.42)
1
P
0.131
Patient sex
Male 1 1
Female 0.58 (0.4 - 0.84) 0.004 0.65 (0.49 - 0.87)
0.205
0.79 (0.55 - 1.14) PMF1 1 10.78
MF classification
SMF 1.66 (1.13 - 2.44) 0.01 1.35 (0.97 - 1.88) 0.071 1.07 (0.67 - 1.7)
Source of stem cells
Marrow 1 1 1
PB 0.83 (0.51 - 1.34) 0.442 0.77 (0.52 - 1.13) 0.178 0.67 (0.41 - 1.09)
Conditioning regimen intensity
MAC 1 1 1
0.107
0.042
0.305
0.008 <0.001
RIC 1.17 (0.79 - 1.73)
Conditioning regimen with
Chemo only 1
TBI 1.25 (0.81 - 1.93)
Type of donor
Matched sibling 1 Unrelated 1.08 (0.77 - 1.51)
Any previous GvHD 0.67 (0.48 - 0.94)
0.434
0.322
0.669
0.02
1.48 (1.07 - 2.04)
1
1.28 (0.89 - 1.82) 1
1.43 (1.09 - 1.89)
0.62 (0.47 - 0.81)
0.017
0.18
0.011 0.001
1.54 (1.02 - 2.35)
1
1.28 (0.8 - 2.06)
1
1.65 (1.14 - 2.39)
0.42 (0.3 - 0.6)
HR: Hazard Ratio; CI: Confidence Interval; MF: myelofibrosis; PMF: primary myelofibrosis; SMF: secondary myelofibrosis; PB: peripheral blood; MAC: myeloablative conditioning; RIC: reduced intensity conditioning; TBI: total body irradiation; GvHD: graft-versus-host disease.Variables that are significantly associated with the risk are in bold.
haematologica | 2019; 104(9)
1785
