
Page 90 - 2019_08-Haematologica-web
P. 90
J-C. Ianotto et al.
molecular status (JAK2V617F or JAK2 exon 12, positivity for CALR or MPL, JAK2 allele burden) and detailed molecular analysis.
The duration of the follow-up was assessed as precisely as pos- sible, the prescribed drugs and the incidence of complications were then recorded: rate and type of antithrombotic drugs (low- dose aspirin, clopidogrel, vitamin K antagonists, heparins), rate and type of cytoreductive drugs (hydroxycarbamide, anagrelide, interferon, ruxolitinib, others), together with information on vene- section requirement, incidence of cardiovascular events (throm- boses and hemorrhages), evolution (ET into PV, ET or PV into sec- ondary myelofibrosis or acute leukemia), and death. With regards to the thrombotic events, the type of vessel and the localization were recorded.
Results
Epidemiology
Only a few papers considered epidemiological data specifically for the MPN population and, it was sometimes difficult to assess the presence or absence of chronic myel- ogenous leukemia among the cases described. Furthermore, there was great variability in the incidence of MPN between countries (United Kingdom, Denmark, Europe, Japan), in the timing of the observation (from 1980 to 2010) and in the age of the patients (below 14 to below 25 years old).
Overall, we found that the global incidence of MPN, in children and young adults, can be estimated to be around 0.82/100,000 patients/year (range, 0.1 to 2.25): the inci- dence of ET is around 0.6/100,000 patients/year (range, 0.004 to 0.9), against 0.18 for PV and 0.53 for primary myelofibrosis (range, 0.003 to 1.5).
Clinical and biological data at diagnosis
Clinical characteristics
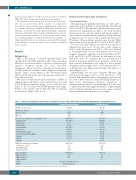
On analyzing the published literature, we were able to collect data on 471 patients, of whom 396 (84%) had ET and 75 (16%) had PV. These patients’ clinical and biological char- acteristics are summarized in Table 1. For each described parameter, we also give the number and the percentage of data available in the published population. The median age at diagnosis was 9.3 years for ET patients and 12 years for PV patients. The percentage of female cases was also differ- ent between the two groups (57.6% in ET and 45% in PV).
The reason for the original consultation was unclear or unknown in most cases. At the time of the diagnosis, 49.6% of the ET patients and 47.5% of PV were declared to be asymptomatic. For the other patients, the two most frequent symptoms experienced were headaches (27.5% in ET and 30.5% in PV) followed by abdominal or bone pain (5.5% and 3.4%, respectively). As a potential bias, a group of 30 patients with ET were declared to suffer from microvascular disturbances but without a more precise description. Interestingly, 13.6% of PV patients and 4.7% of ET patients were diagnosed following a thrombotic or hemorrhagic event.
Splenomegaly was the most frequent abnormal sign described in the papers: 54.7% of ET and 15.3% of PV patients had a palpable spleen. Surprisingly, its presence did not seem to have induced so many abdominal symptoms as there were discrepancies between frequencies of splenomegaly and reported abdominal pain. It is also hard to understand the much higher frequency of splenomegaly in ET and the fact that this does not seem to have correlated with abdominal vein thrombosis, for example.
Table 1. Clinical and biological characteristics at diagnosis of very young patients with essential thrombocythemia or polycythemia vera.
Number of cases (%)
Median age (years)
Range ( years)
Male (%)
Reasons for consultation or symptoms, n (%) Asymptomatic
Thrombosis
Hemorrhage
Splenomegaly
Headaches
Abdominal/bone pain Paresthesia/erythromelalgia Syncope
Fatigue
Pruritus
Full blood counts at presentation Leukocytes, x 109/L Hemoglobin, g/L
Platelets, x 109/L
Driver mutations JAK2 exon14, n Allele burden, % JAK2 exon12, n CALR, n
Essential thrombocythemia
396 (84)
9.3
0.2-20
42.4
*236 (59.6) 117 (49.6) 7 (3)
4 (1.7) 129 (54.7) 65 (27.5) 13 (5.5) 11 (4.7) 3 (1.3)
2 (0.8)
0
*229 (57.8) 10.6 131 1192
*388 (98.2)
130
24.1
-
23 (type1, n=9; type2, n=6) 4 (L, n=2; K, n=1)
Polycythemia vera
75 (16)
12
0.6-19
55
*59 (78.7) 28 (47.5) 5 (8.5) 3 (5.1) 9 (15.3) 18 (30.5) 2 (3.4) 1 (1.7) 3 (5.1) 4 (6.8) 3 (5.1)
*67 (89.3) 13.2 157 799
*75 (100) 30 43.5
2
-
MPL, n
*indicates the number and percent of available data for each category of parameters.
1582
haematologica | 2019; 104(8)
