
Page 68 - 2019_08-Haematologica-web
P. 68
V. Picard et al.
Stomatocytes were absent in ten of the 12 cases of KCNN4-HX and rare in the other two cases (Figure 2F). Finally, with regards to PIEZO1-HX, we compared carriers of p.Arg2456His (n=15) and p.Leu2495_Glu2496dup (n=20) to those with all other mutations. Hemoglobin level was lower for both recurrent mutations, although only statistically significantly for p.Leu2495_Glu2496dup [mean hemoglobin: 121.3±11.1 g/L (p.Leu2495_Glu2496dup) vs. 130.6±14.5 g/L (p.Arg2456His) vs. 143.7±16.7 g/L (all other mutations); P<0.05]. There was no difference in terms of reticulocyte count (290±74 x109/L vs. 344±76 x109/L vs. 325±131 x109/L, P=NS).
Splenectomy and thrombotic events
We recorded thrombotic events in four non-splenec- tomised patients: a 51-year old man with transient cere- bral stroke, a 31-year old female HbS carrier with splenic infarction who was then splenectomized and presented severe thrombotic events after splenectomy, an 18-year old female with painful splenic infarcts and a 52-year old man with hepatic artery thrombosis after liver transplan- tation for hepatocarcinoma. In contrast, thrombotic events were frequent in splenectomized patients. Overall, 16 patients underwent splenectomy, including eight PIEZO1-HX patients from eight families and four KCNN4-subjects from two families. Genetic diagnosis
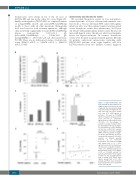
A
B
CD
EF
Figure 3. Hyperferritinemia and iron overload. (A, B) Ferritin level at diagnosis was correlated to the age of patients: the later in life the diag- nosis was made, the higher the fer- ritin level was: the mean ferritin level was 273 ±141 ng/mL in patients < 20 years vs. 717±441 ng/mL in patients between 20-40 years (P<0.05) vs. 1409±653 ng/mL in those older than 40 years (P<0.05). (C) Percentages of patients receiving chelation thera- py, depending on the age at diagno- sis. (D) Efficiency of iron chelation on liver iron content (LIC), evaluat- ed by magnetic resonance imaging (MRI), between patients at diagno- sis (n=20) and patients at last fol- low-up (n=14): mean LIC: 200±103 μmol/g vs. 88±42 μmol/g, P<0.001. (E, F) Correlation between LIC assessed by liver MRI and ferritin level (< or > 1000 ng/mL) for patients for whom these two data were available simultane- ously: LIC: 318±31 μmol/g for patients with ferritin >1000 ng/mL (n=7) vs. 113±68 μmol/g for patients with ferritin <1000 ng/mL (n=25), P<0.001. (E) Eight patients with a ferritin level below 1000 ng/mL already had a LIC >150 μmol/g, and (F) no clear correlation was found between LIC and ferritin below 1000 ng/mL.
1560
haematologica | 2019; 104(8)
