
Page 53 - 2019_08-Haematologica-web
P. 53
Rapid growth and hepcidin suppression in infancy
despite higher inflammatory burden later in infancy, reflected by increased CRP and AGP concentrations (Figure 1C and D). Plasma iron showed the most striking decline of any iron biomarker, with concentrations falling from birth in all infant groups, irrespective of sex or birth- weight, to concentrations well below normal expected values for iron replete young children (typically >10 μmol/L)31 by five months of age in both cohorts (Figure 1E). Concentrations of sTfR, commonly used as a surro- gate for erythropoietic iron demand, were reduced at two months of age (until when erythropoietic output is likely to have been low32) in both cohorts. Erythropoietic activ- ity typically increases from around this age, and is likely influenced by the declining plasma iron availability; con- sistent with this, sTfR and transferrin concentrations were both elevated by 12 months of age, again most notably in lower birthweight males (Figure 1F and G). Accordingly,
this group had the lowest hemoglobin concentration by 12 months of age (Figure 1H), and by this time the popu- lation had experienced a heavy burden of iron deficiency and anemia: 67.7% (95%CI: 56.2-79.2%) and 36.4% (95%CI: 25.6-47.3%) of females, and 77.8% (95%CI: 65.6-90.0%) and 45.3% (95%CI: 34.5-56.1%) of males in VPM and VA, respectively, were classified as iron deficient at 1 year of age; 86.5% (95%CI: 79.5-93.5%) of females and 93.1% (95%CI: 87.8-98.4%) of males were classified as anemic in VA (in which hemoglobin was measured) (Online Supplementary Table S3).
Associations with hepcidin and ferritin concentrations at five and 12 months of age: cross-sectional analyses
To explore the relationships of hepcidin and ferritin with other variables during infancy, we next performed cross-sectional univariable analyses at month 5 (the time
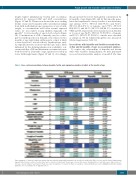
Table 1. Cross-sectional correlations between hepcidin, ferritin, and explanatory variables in infants at five months of age.
Data summarize 100 datasets in which any missing data were imputed using multiple imputation as described in detail in the Methods section and the Online Supplementary Appendix. Infection was coded as “no infection=0” and “occurrence of infection=1’; Season was coded as “dry season (November-June)=0” and “wet season (July-October)=1”; Sex was coded as “female=0” and “male=1”; Head Circ.: head circumference.“r” denotes the Pearson correlation coefficient. Significance level is highlighted with blue shading. Dark blue: P<0.001; mid-blue: P<0.01; light blue: P<0.05.
haematologica | 2019; 104(8)
1545
