
Page 171 - 2019_08-Haematologica-web
P. 171
ATRA protects impaired BM MSC in ITP
assigned to the group without complement activation (MSC-ITP-C- group). Forty-two healthy volunteers served as a control group (MSC-control group) (Online Supplementary Table S1). To further distinguish ITP patients with complement activation in bone marrow, deposition of complement proteins was also determined by indirect immunofluorescence assays (Figure 1H, I). In accordance with the results of the indirect ELISA, MSC from ITP patients in the MSC-ITP-C+ group were evidently stained with the complement components, especially C4d and C5b-9 (Online Supplementary Figure S1).
Intrinsic mRNA alterations in complement-activated mesenchymal stem cells from patients with immune thrombocytopenia
To investigate whether the MSC from patients in the
MSC-ITP-C+ group show transcriptome abnormalities and to better understand molecular pathways that may regu- late MSC-ITP-C+ biology, we performed an mRNA expres- sion analysis by microarray.
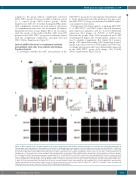
Unsupervised clustering analysis comparing MSC-ITP- C+ to MSC-ITP-C- and MSC-control showed distinctive gene expression signatures and we observed differential expression (fold change >2, P<0.05) of 2,978 probes between the groups, with 1,926 upregulated and 1,052 downregulated (Figure 1A). Bioinformatics analysis was used to identify complement, IL-1 family, IL-1 receptor family, CXC chemokine family, CXC chemokine receptor family, tumor necrosis factor (TNF) family and TNF recep- tor family-related genes that were differentially expressed in the MSC-ITP-C+ group (fold change >2.0, P<0.05) (Online Supplementary Figure S2A-D).
ABC
D
EFG
HI
Figure 1. Mesenchymal stem cells with complement deposition from patients with immune thrombocytopenia are genetically and functionally abnormal. (A) Unsupervised clustering analysis of differentially selected probes. (B) Morphology of mesenchymal stem cells (MSC) from the three groups (MSC-ITP-C+: MSC from patients with immune thrombocytopenia with complement deposition on MSC; MSC-ITP-C- MSC from patients with immune thrombocytopenia without complement deposition on MSC; MSC-control: MSC from healthy subjects) under a light microscope (original magnification ×3200; scale bar: 200 μm). (C) The growth curves of the MSC-ITP-C+ (n=26), MSC-ITP-C- (n=32) and MSC-control (n=42) groups at passage 3 from four independent experiments. One-way analysis of variance (ANOVA). (D) Cell apoptosis of MSC determined by annexin V assays (MSC-ITP-C+, n=12; MSC-ITP-C-, n=21; MSC-control, n=12; one-way ANOVA). (E) The levels of tumor necrosis factor-α (TNF-α), interleukin-1β (IL-1β), CXCL12, and the complement factors C3a and C5a in bone marrow supernatants from the MSC-control (n=42), MSC-ITP-C- (n=32) and MSC-ITP-C+ (n=26) groups; one-way ANOVA). (F) The correlation between the level of IL-1β in culture supernatants and C5b-9 deposition on MSC (R2 = 0.7426, P<0.001, Spearman rank correlation rho). (G) Levels of factor H in MSC culture supernatants 12, 24, and 48 h after co-culture with TNF-α, determined by enzyme-linked immunosorbent assays (paired t-tests). (H, I) Intracellular expression of IL-1β and CXCL12 in MSC-ITP-C+, MSC-ITP-C- and MSC-control, determined by immunofluorescence assays. Scale bar: 100 μm. DAPI: 4′,6-diamidino-2-phenylindole.
haematologica | 2019; 104(8)
1663
