
Page 206 - 2019_07 resto del Mondo-web
P. 206
A.S. Macwan et al.
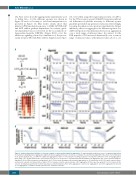
1A). Raw curves from the aggregometry experiments used to define ΔCnres for the different agonists are shown in Figure 1B and a color map to aid visual interpretation is provided in Figure 1C. Our results clearly show that platelet GPCR-mediated responses to PAR1-AP, PAR4-AP and ADP exhibit gradient dependence. In contrast, gradi- ent dependence was not observed for the cross-linked col- lagen-related peptide (CRP-XL), (Figure 1B-D) or for the inhibitory signaling elicited by stimulation of the prosta- cyclin receptor (IP) with PGE1 (Online Supplementary Figure
AB
S3), even when using the longest infusion time of 1,280 s. For the TPa receptor agonist (U46619), large inter-individ- ual differences in platelet reactivity to different agonist gradients precluded any general conclusions. Interestingly, lowering the infusion rates produced qualitatively distinct inhibitory effects on aggregation for different agonists. For ADP, GDI produced incremental decreases in aggregation over a wide range of infusion times. In contrast, for the PAR peptides, GDI increased dramatically over a narrow range of infusion times, with infusion times above a cer-
C
D
Figure 1. Gradient-dependent inhibition of G protein-coupled receptor-mediated platelet aggregation. To experimentally verify the presence of a gradient-dependent mechanism modulating platelet aggregation, light transmission aggregometry was conducted according to the experimental algorithm in (A), where the identification of an agonist gradient (ΔCnres) at which no significant aggregation (<25%) occurred despite reaching an agonist concentration sufficient to elicit strong aggregation when using a 2 s agonist infusion time, was interpreted as proof of the presence of gradient-dependent inhibition. (B) Aggregation raw curves obtained using the algorithm in (A) for different agonists and gradients, n≥5. (C) Heat map showing mean maximum aggregation for all experiments in (B). (D) Logistic regression was performed to calculate the infusion time at which >50% of samples could be expected to give <25% aggregation for the respective agonists (t50). Dots represent the outcome of individual experiments for which data have been dichotomized so that >25% aggregation is denoted as “aggregation” and <25% aggregation is denoted as “no aggregation”. Confidence bands represent 95% confidence intervals.
1484
haematologica | 2019; 104(7)
