
Page 164 - 2019_07 resto del Mondo-web
P. 164
J.R. Jones et al.
Committee (MREC 17/09/09, ISRCTN49407852). A nested case control analysis was performed on 56 patients who received either lenalidomide maintenance (n=30) or were observed (n=26) and subsequently relapsed25,26 (Online Supplementary Figure S1). All patients included had phenotypical high-risk disease, defined as relapse within 30 months of maintenance randomization, irre- spective of classical genetic risk status and best response. The median time from trial entry to relapse was 19 months, notably shorter than the progression-free survival (PFS) reported in the Myeloma XI trial of 35.9 and 32.9 months for patients treated with lenalidomide and thalidomide induction, respectively.27 Response was determined using International Myeloma Working Group (IMWG) criteria and a near complete response (nCR), defined as no detectable paraprotein, a normal light chain ratio, but where immunofixation and or bone marrow sampling was not performed or if immunofixation was positive. Prior to relapse, 21% (12 of 56) achieved a CR, 21% (12 of 56) a nCR, 42% (23 of 56) a very good partial response (VGPR), and 16% (9 of 56) a par- tial response (PR). To determine the impact of response on the genetic landscape at relapse we grouped patients according to the best response achieved prior to relapse, complete responders
AB
(CR/nCR) and non-complete responders (VGPR/PR). Clinical char- acteristics were well matched between the maintenance groups (Table 2). Patients' characteristics according to induction regimen were also well matched (Online Supplementary Table S1).
DNA was isolated from plasma cells following selection using CD138+ MACSorting (Miltenyi Biotech, Bisley, UK) from bone marrow aspirate samples. Control DNA was obtained from peripheral blood samples. Libraries for WES were prepared using the SureSelectQXT sample prep kit and the SureSelect Clinical Research Exome kit (Agilent), with additional baits covering the immunoglobulin and MYC loci, as previously described.28 Paired- end sequencing was performed to a median sequencing depth of 122x for tumor samples and 58x for controls using a HiSeq2500 (Illumina). Single nucleotide variants, including those of tumor suppressor genes and oncogenes, were determined using Strelka (v.1.0.14) and MuTect.29,30 The distribution of mutant alleles deter- mined by the variant allele frequency (VAF) was mapped using the R package SciClone.31 Cancer clonal fractions (CCF) were calculat- ed for all mutations and plotted using Kernal density estimation to infer clonal structure at presentation and relapse.32
Copy number was assessed using both multiplexed ligation-
C
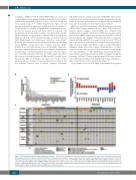
Figure 1. The mutational profile at presentation and relapse. (A) Recurrent mutations in myeloma and mutations within the genes associated with immunomodu- latory agent action. The number of patients with these mutations at presentation, relapse, and at both time points is shown (dotted line denotes level of 10%). (B) Summary of mutations gained and lost at relapse. New mutations at relapse were seen in PRDM1, TP53, NF1, TET2, EGFR, MYC, DDB1, CRBN, and FAF 1 (red bars). Loss of mutations in FANCA, DIS3, FAM46C, BRAF and CDH2 were noted at relapse (blue bars). Mutations in NRAS, KRAS, and SLC16A1 were gained and lost at relapse. (C) Mutational profile for each patient at presentation and relapse. Maintenance strategy and best response prior to relapse is shown. The gain and loss of mutated genes typical of multiple myeloma (MM) was a dominant feature.
1442
haematologica | 2019; 104(7)
