
Page 71 - 2019_06-Haematologica-web
P. 71
Prognosis of -7/del(7q) in Ph- cells and underlying MDS
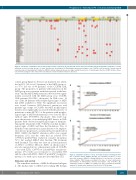
Figure 1. Landscape of mutations detected by next-generation sequencing in patients with chronic myeloid leukemia and myelodysplastic syndromes. Columns (patients) are first sorted by the type of clonal chromosome abnormalities in Philadelphia chromosome-negative cells (CCA/Ph-), then by disease [chronic myeloid leukemia in green, myelodysplastic syndrome (MDS) in yellow, advanced disease in orange) and by the presence of morphological features of MDS (in blue charac- ters) from the youngest to the oldest. Pink cells indicate somatic mutations that were detected.
control group (Figure 1). At least one mutation was identi- fied in 90% (10 out of 11 patients) of the MDS group ver- sus 37% (16 out of 43 patients) of the CCA/Ph- CML group. The proportion of patients with mutations in the MDS group was consistent with that reported in the liter- ature16 and the MDS/AML mutations detected were signif- icantly associated with the MDS group versus CCA/Ph- CML patients (P<0.0011, chi-square). In CML cases, 13 out of the 24 patients with morphological signs of MDS had DNA available for NGS. No significant association was found between NGS-detected mutations and patients’ age or type of CCA/Ph- but MDS morphological features were significantly associated with the presence of mutations as nine (68.75%) of the patients with morpho- logical signs of MDS had mutations versus four (31.25%) without signs (P<0.00001, chi-square). This result sup- ports the presence of an underlying MDS disease in CML patients with observed morphological signs of dysplasia. Among the 12 patients with -7/del(7q), four had morpho- logical signs of MDS and three had mutations. Two of them had some mutations in a gene known to be implicat- ed in disease progression: one patient had an undescribed EZH2 c.826C>T:p.Gln276* alteration with a low variant frequency (1%), and the other had an isolated TP53 c.709A>C:p.Met273Leu mutation (variant frequency, 71%) but reached MR4.5 after first-line TKI treatment with dasatinib. The other two have an isolated mutation of ASXL1 or STAG2. Of note, EZH2 on chromosome 7 was also mutated in two other patients with +8 CCA/Ph- : one with EZH2 c.2079T>A: p.Asn693Lys (variant fre- quency, 17%) with a poor response to second-line TKI and the other with EZH2 c.826C>T:p.Gln276* (variant fre- quency, 1%) with a poor response after third-line TKI.
Outcomes and survival
The cumulative incidence of MR4.5 is illustrated in Figure 2. The median time to MR4.5 after starting TKI therapy
A
B
Figure 2. Cumulative incidence of deep molecular response following the first line of tyrosine kinase inhibitor therapy. (A) Cumulative incidence of deep molecular response (MR4.5) following initiation of the first line of tyrosine kinase inhibitor (TKI) therapy according to the type of clonal chromosome
- abnormalities in Philadelphia chromosome-negative cells (CCA/Ph). (B)
Cumulative incidence of MR4.5 according to the type of CCA/Ph- by landmark analysis 36 months after initiation of the first line of TKI therapy.
haematologica | 2019; 104(6)
1153
