
Page 202 - 2019_06-Haematologica-web
P. 202
F.I. Mulder et al.
ences in follow up by using 6-month outcome data, con- siderable residual heterogeneity was observed in the analyses. This is expected in meta-analyses of predictive model performance, especially when evaluating risk assessment tools across various cancers.18 Nonetheless, we believe the presented estimates overall and for subgroups by cancer type are the most reliable ones based on the cur- rent literature, and can help clinicians to decide whether to use the score in their practice.
Two currently ongoing randomized trials use the Khorana score to select cancer patients at high risk of VTE for thromboprophylaxis (clinicaltrials.gov identifier: 02048865 and 02555878). Interestingly, these studies apply a positivity threshold of 2 points rather than the conven- tional 3 points. Our analyses demonstrate that this approach increases the proportion of patients classified as high risk (17-47%) while in parallel decreasing the absolute risk of VTE in this group (11-9%). As a conse-
Table 3. Summary estimates for 6-month and total follow-up duration.‡ Incidence
Relative risk versus lower risk groups
Proportion of all VTE Khorana score ≥3
of VTE Khorana Khorana Khorana score 0 score 1-2 score ≥3
Khorana score ≤1
Khorana
Khorana Khorana score ≥3 score ≥2
score≥2
%(95%CI) %(95%CI) %(95%CI) %(95%CI) %(95%CI) (95%CI) (95%CI) %(95%CI)
6 months follow-up duration
Total study follow-up duration*
5.0 (3.9-6.5) 6.6 (5.6-7.7) 11.0 (8.8-13.8) 5.5 (4.5-6.9) 8.9 (7.3-10.8) 1.8 (1.5-2.1) 1.5 (1.3-1.8) 23.4 (18.4-29.4)
5.7 (4.2-7.9) 8.6 (7.3-10.2) 14.0 (11.7-16.7) 6.8 (5.2-8.9) 11.3 (9.4-13.4) 1.7 (1.5-2.0) 1.5 (1.3-1.8) 23.7 (18.7-29.5)
Low and moderate bias studies only
6 months follow-up duration 4.6 (3.2-6.5) 6.1 (5.0-7.4) 11.1 (8.3-14.7) 5.0 (4.0-6.3) 8.3 (6.4-10.7) 1.9 (1.5-2.3) 1.6 (1.3-2.0) 24.4 (17.8-32.5
Total study follow-up duration* 4.5 (3.0-6.7) 7.6 (6.0-9.5) 13.5 (10.7-16.8) 6.3 (4.9-8.1) 10.6 (8.4-13.2) 1.8 (1.4-2.2) 1.5 (1.2-1.9) 22.9 (17.2-29.9)
‡Estimates were derived from random effects meta-analysis. *Total follow-up duration varied substantially complicating interpretation of the results at total follow-up duration. CI: confidence interval;VTE: venous thromboembolism.
C
D
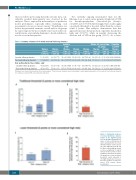
Figure 3. Estimated incidence of venous thrombosis and pro- portion in the high-risk group over six months. Estimated inci- dence of venous thrombosis (A and C) and proportion of venous thromboembolic events allocat- ed to the high-risk group (B and D). When considering two points or more as high-risk (C and D) instead of three points or more (traditional threshold, A and B), the proportion of venous throm- boembolic events allocated to the high risk groups increases, but also results in a lower inci- dence. VTE: venous throm- boembolism.
AB
5.0%
1284
haematologica | 2019; 104(6)
