
Page 93 - 2019_05-HaematologicaMondo-web
P. 93
Ruxolitinib, nilotinib and prednisone for myelofibrosis
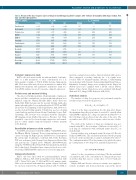
Table 2. Results of the dose-response curves of drugs in monotherapy in patients' samples after 72 hours of incubation with drugs: median. First (Q1) and third (Q3) quartiles.
Patients’samples Drugs
Panobinostat
EC50 (μM) Median Q1
0.008 0.002
Q3
0.024
Median
3.3
6.4 26.0 39.9 28.3 0.0 72.1 45.8 0.0 2.5 45.4 0.0 0.0 0.0
Emax (%Survival)
Q1 Q3
0.0 7.5
1.9 11.0 24.6 28.6 16.6 43.7 25.8 34.4 0.0 0.0 72.1 72.1 38.3 51.7 0.0 0.0 0.0 10.3 39.6 51.3 0.0 0.3 0.0 0.0 0.0 0.0
0.033 0.002 0.144 0.079 0.041 0.029 0.893 0.866 1.716 1.317 1.961 1.961 3.518 2.528 4.517 2.674 5.996 4.804 9.220 8.026
Bortezomib
Prednisolone
HSP990
BKM120
Ponatinib
Pomalidomide
Anagrelide
Bosutinib
Nilotinib
Danazol
Sorafenib 10.272 10.164 10.897 Everolimus 22.606 17.676 25.872 SB431542 27.334 16.362 38.307
0.056 0.286 0.048 0.964 3.341 1.961 6.787 9.740 9.651 10.414
Collagen I expression study
inactivate endogenous peroxidase. After incubation with a perox- idase-conjugated secondary antibody for 1 h, signals were revealed with 3,3 diaminobenzidine (Abcam). Counterstaining was performed with Carazzi's hematoxylin (AppliChem Panreac, Darmstadt, Germany). Images were visualized on the Eclipse 80i (Nikon) microscope equipped with a DS-Fi1 camera (Nikon, Minato, Tokyo, Japan). Stained areas were calculated with ImageJ (Rasband, W.S., ImageJ, NIH, Bethesda, MD, USA).
Statistical analysis
The analysis of drug dose-response was performed using the non-linear regression model (Equation 1):
E=E0+Emax−E01+ 10(logEC50−C)
where C is the drug concentration; E is the drug effect; Emax, the maximum drug efficacy in terms of survival; E0, survival when only DMSO is applied; EC50, drug concentration in which 50% of the total drug action is achieved; and γ the slope of the curve. The area under curve (AUC) of dose response curves was also calculat- ed.
The study of the behavior of drugs in combination was per- formed using ΔEC50, the percentage of difference between EC50 of each drug in combination with ruxolitinib minus their EC50 in monotherapy.
Synergy analysis was performed using Calcusyn v.2.0 (Biosoft, Ferguson, MO, USA). The calculations performed by the program are based on the median-effect equation formulated by Chou.22 The combination index (CI) is the parameter by which the syner- gy or antagonism of two drugs were quantified (Equation 2):
𝐶𝐼= 𝐶𝐷𝐶𝐷|𝑅+𝐶𝑅𝐶𝑅|𝐷
where CD is the concentration of each drug, CR is the ruxolitinib concentration, and is the concentration of a drug in the presence of another drug that causes a certain effect. A CI <0.8 indicates synergism.
Shapiro-Wilk and Levene’s robust test statistic were applied to evaluate normality and homoscedasticity, respectively. Linear
Hs27a cells were treated with 100 nM ruxolitinib, 1 mM nilo- tinib or 1 mM prednisone or their combinations for 1 h. Subsequently, 2 ng/mL of TGF-β (R&D Systems, Minneapolis, MN, USA) was added and cells were incubated for a further 24 h. Immunocytochemistry and quantitative polymerase chain reac- tion (qPCR) analysis was used to measure collagen I expression.
Protein array and western blotting
The effects of 32 nM ruxolitinib, 1.6 mM nilotinib, 0.8 mM pred- nisone and their combinations, on protein phosphorylation were analyzed using the Human Phospho-kinase Array (Proteome ProfilerTM, R&D Systems) and by western blotting. Antibodies against phosphorylated or non-phosphorylated STAT5 and ERK 1/2 proteins (Cell Signaling Technology, Danvers, MA, USA) were used in western blotting analysis. Tubulin was used as a loading control and was purchased from Abcam (Cambridge Science Park, Cambridge, UK). Proteins were visualized with the ChemiDoc MP imaging system (BioRad laboratories, Hercules, CA, USA), quantified, corrected for housekeeping expression, and normal- ized to control samples using the ImageLab software program (v.5.1, BioRad).
Quantitative polymerase chain reaction
Total RNA was prepared with the AllPrepTM DNA/RNA Micro Kit (Qiagen, Hilden, Germany). Reverse transcription reaction was carried out using the High Capacity cDNA Reverse Transcription Kit system (Life Technologies, Carlsbad, MA, USA). Real-time PCR was performed with Taqman Gene Expression Master Mix and gene-specific Taqman probe COL1A1 (Hs00164004_m1) using the 7900HT Fast Real-Time PCR Systems platform (all from Life Technologies). Normalized gene expression levels were calcu- lated using GAPDH mRNA expression as a housekeeping gene.
Immunocytochemistry
HS27a cells were fixed with 4% paraformaldehyde (Merck Millipore, Billerica, MA, USA) permeabilized and blocked with 0.25% Triton X-100 plus 1% BSA in PBS for 30 minutes (min). Slides were incubated with antibodies against collagen I (Abcam) for one hour, followed by a 5-min incubation with 3% H2O2 to
haematologica | 2019; 104(5)
939
