
Page 85 - 2019_04-Haematologica-web
P. 85
Mirabegron in MPN
Results
Patients and study treatment
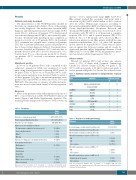
The characteristics of the 39 MPN patients enrolled in the study are summarized in Table 1. None of the patients was newly diagnosed. The median time between MPN diagnosis and trial registration was 3.6 years (range 1.6-8.6 years). Prior to inclusion, 30 patients (77%) had received cytoreductive therapy and 21 (55%) were treated by phle- botomy. Treatment with mirabegron was completed as per protocol in 32 out of 39 patients (82%). In 2 patients (5%), treatment was stopped due to toxicity, in 2 patients (5%) due to patients' preference, and in one patient (3%) due to breast cancer diagnosis (Table 2). Treatment devia- tion was described in 16 patients (41%) and was due to patient’s decision (n=6; 15%), doctor’s decision (n=1; 3%), toxicity (n=2; 5%) or other reasons (n=12; 31%). Thirty- six patients (92%) received concomitant medication (Table 2).
Mutational profiles
In 33 out of 39 patients (84%) who consented to this subproject, granulocyte DNA was sequenced at study entry using a next-generation sequencing (NGS) panel of 94 genes (Table 3). In 10 out of 33 patients (30%), addi- tional somatic mutations were detected (Table 3) and in 3 of these patients (9%) two concomitant mutations were present (TET2 and DNMT3A, PIAS2 and TYK2, TP53 and PRPF40B). The presence or absence of additional muta- tions was not associated with clinical or laboratory param- eters.
Response
None of the patients reached the primary end point of a 50% or more reduction of JAK2-V617F allele burden at 24 weeks (Figure 1 and Online Supplementary Appendix). The median percent change from baseline to week 24 was an
increase of 6.1% [interquartile range (IQR) 3.2-13.8%]. One patient reached the secondary end point with a reduction of JAK2-V617F allele burden of 25% or more after 24 weeks. Hematologic response according to European LeukemiaNet (ELN) and International Working Group Myeloproliferative Neoplasms Research and Treatment (IWG-MRT) criteria was observed in 5 out of 21 patients with PV (24%): 2 of them had a complete response (CR) (10%) and 3 a partial response (PR) (14%) (Table 4). Two of 7 ET patients (29%) showed a PR, i.e. reduction in platelet count. One patient with MF became transfusion-independent (9%), all other MF patients (n=10) showed no response (91%). There was no differ- ence in spleen size between baseline and 24 weeks by ultrasound [median spleen longitudinal diameter 15 cm (IQR 13-21) vs. 16 cm (IQR 14-19)]. All parameters meas- ured are listed in Online Supplementary Table S1.
Adverse events
Overall, 33 patients (85%) had at least one adverse event, 3 (8%) of them with Common Terminology Criteria for Adverse Events (CTCAE) 4.0 grade 3, 12 (31%) with worst grade 2, 18 (46%) with worst grade 1, and no patient with grade 4 or 5 event. Five adverse events
Table 3. Additional somatic mutations in myeloproliferative neoplasm patients.
Gene
TET2
Mutation
M695fs, K1125E, E1339D, T1393I, Y1345C
Patients (n=33) N%
515
13 13 13 13 1 3 1 3 1 3 1 3
Value N=39
6.1 (3.2–13.8)
0
1 (3%)
2 (10%) 3 (14%) 16 (76%)
2 (29%) 5 (71%)
1 (9%)
10 (91%)
Table 2. Treatment.
Total dose of mirabegron [mg]
Total treatment duration [weeks] Total dose per week [mg]
Main reason for stopping treatment
Treatment was completed as per protocol Unacceptable toxicity
Other*
Missing
Patients receiving any concomitant medication
Concomitant medication
Hydroxyurea
Thioguanin
Pipobroman
Anagrelide
Phlebotomy
Other cytoreductive drugs Other treatment
Value N=39
9275 (8875–9775)
27.0 (25.9–28.3) 345 (344–345)
32 (82%) 2 (5%) 3 (8%) 2 (5%) 36 (92%)
20 (51%) 0
0
0
11 (28%) 3 (8%) 35 (90%)
DNMT3A V468M GSN R687Q JAK2 E282G NFE E45G PIAS2 S533delinsWS PRPF40B A597T TP53 H179R TYK2 V673L
Table 4. Response to mirabegron therapy. Outcome
Percent change of allele burden at 24 weeks
Allele burden reduction of 50% at 24 weeks Allele burden reduction of 25% at 24 weeks Overall hematologic response in PV, n = 21
CR
PR
No response
Overall hematologic response in ET, n = 7 PR
No response
Overall hematologic response in MF, n = 11
Improvement of anemia
No response
Data are presented as number of (N) of patients (%) or median (interquartile range). *The reasons categorized as “Other” are patients’ wish and a breast cancer diagnosis.
Data are presented as number (N/n) of patients (%) or median (IQR). PV: poly- cythemia vera; CR: complete response; PR: partial response; ET: essential thrombo- cythemia; MF: myelofibrosis.
haematologica | 2019; 104(4)
713
