
Page 78 - 2019_04-Haematologica-web
P. 78
M. Kenealy et al.
infection (7 in AZA, 10 in LEN+AZA). For full listing of cause of death according to treatment arm see Online Supplementary Table S2.
The only other non hematologic toxicity seen at rates >5% was raised GGT in 15 patients with no significant difference between the arms (AZA n=4 LEN+AZA n=11; P=0.1). Hematologic toxicity. Comparing data from cycle 3 to cycle 12 (as LEN was introduced from cycle 3 onwards), there was no association between treatment arm and cycle for any of the hematologic grade 3+ toxicity rates was observed. For Hb <80g/L and for neutrophils and platelets >50% reduction from baseline count, there was no differ- ence between treatment arms but a statistical significant difference across the cycles for both arms. See Figure 1. Emerging Grade 3+ hematologic toxicity. For those patients who did not have a grade 3+ toxicity at baseline as defined by CT CAE V4.0 (N), there was a non significant trend to greater treatment emergent neutropenia (78% vs. 68%) and thrombocytopenia (63% vs. 50%) in the combination arm (Online Supplementary Table S3).
Efficacy
Summary of efficacy endpoints is provided in Table 4.
The primary endpoint of rate of clinical benefit at 12 months (alive with stable disease or better) in the AZA arm was 65%, and 54% in the LEN+AZA arm (Fishers Exact test, P=0.2). There was no difference in rate of clinical benefit between each treatment arm according to WHO diagnostic subgroup (MDS, AML or CMML) or according to IPSS-R.
There was no difference in clinical benefit across disease subtype within either the LEN+AZA or the AZA treated groups.
The overall response rate (best response of HI, PR, mar- row CR or CR) with AZA was 57% and 69% in LEN+AZA (P=0.14).
CR was achieved in 17 patients (22%) on AZA and 20 patients (25%) on LEN+AZA.
There was no difference in type of HI across the 2 arms.
The median time to best response for those achieving a HI or better was not different between treatment arms; 5.5 months (range 1.8-11.7) AZA and 4.8 months (range 1.8-12.4) LEN+AZA. Median time to first response (of HI or better) was 2.8 months (range 1.6-9.2), with no differ- ence between the arms (P=0.13).
There were no significant associations found for these variables with respect to response – either clinical benefit at 12 months as defined by primary endpoint, or for over- all response rate of best response HI or better.
Using univariable subgroup logistic regression models of treatment effect on primary endpoint response (clinical benefit stable disease or better at 12 months), there were no significant associations for age, sex, WHO diagnosis, IPSS, IPSS-R or cytogenetic risk group (Online Supplementary Figure S1).
Cytogenetic response
Fifty-nine patients had a karyotypic abnormality detect- ed at baseline, 28 in the AZA arm and 31 in the LEN+AZA arm. A total of 29% (8) of patients on the AZA arm had a cytogenetic response. Half (4) of those achieved a com- plete cytogenetic response while the other half (4) achieved a partial response with a ≥50% reduction in the chromosomal abnormality. A total of 39% (12) patients in the LEN+AZA arm had a cytogenetic response, 11 of them
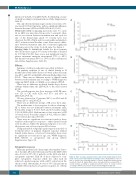
A
B
C
D
Figure 2. Time to relapse, progression-free and overall survival between treat- ment cohorts, and overall survival according to risk. A. Kaplan-Meier curves of time to relapse after achieving CR/PR, or disease progression between both treatment cohorts. B. Kaplan-Meier curves of progression-free survival (PFS). C. Overall survival according to assigned treatment cohort. D. Overall survival according to IPSS-R; very low/low versus intermed/high/very high risk.
706
haematologica | 2019; 104(4)
