
Page 219 - 2019_04-Haematologica-web
P. 219
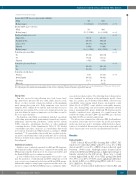
Toxicity in related versus unrelated HSC donors
continued from the previous page
Average daily G-CSF dose per donor weight ( g/kg/day)
N Eval
Median (range)
Absolute CD34+ at pre-collection
N Eval
Median (range)
Total blood volume processed
Small, <12 L Standard, 12-18 L Large, ≥ 18 L Unknown Median (range)
Central line placement-Male No
Yes
Unknown
Central line placement-Female
No
Yes
Central line site-All donors
Femoral Internal jugular Subclavian Other site
914
10.3 (4.7-22.1)
539
87.0 (7.1-1342)
54 (06) 325 (34) 576 (60)
1 (N/A) 20.0 (0.3-112.6)
470 (88) 67 (12) 0 (N/A)
259 (62)
160 (38)
8 ( 4) 208 (92) 11 ( 5) 0
8183
10.6 (5.5-18.7)
8283
80.0 (0.3-2123)
233 (03) 1882 (23) 6182 (75) 10 (N/A) 21.2 (0.7-45.4)
5219 (98) 121 ( 2) 1 (N/A)
2460 (83)
506 (17)
209 (33) 389 (62) 26 ( 4) 3 (<1)
<0.001
<0.001
<0.001
0.040 <0.001
<0.001
<0.001
RD:relateddonor;URD:unrelateddonor;N:number;NEval:numberevaluated;BMI:BodyMassIndex;G-CSF:granulocyte-colonystimulatingfactor.aPearsonc2 testwasused for comparing discrete variables; the Kruskal-Wallis test was used for comparing continuous variables. bApplicable to RD only.
End points
Pain was assessed for the following sites: back, bones, head, hip, intravenous injection (IV) site, joints, limbs, muscles, neck, throat, or other. Severity of pain was defined as the maximum grade among these pain sites. Body symptoms were assessed using the MTC outlined above and the peak toxicity level across symptoms was analyzed. Recovery to pre-donation levels by one year was defined as a pain or symptom score less than or equal to the score at pre-donation.
Pre-donation comorbidity ascertainment included: assessment of bleeding, gastrointestinal, genitourinary, hematologic, hepatic, pulmonary, cardiovascular, psychiatric, central nervous system (CNS), endocrine, autoimmune disorders, or other significant coexisting diseases (Online Supplementary Table S1). We divided comorbidities into three categories: 1) comorbidities that would not result in deferral from URD donation according to NMDP standards;10,11 2) comorbidities that would have resulted in defer- ral; and 3) comorbidities that could possibly have led to a deferral, but more detailed donor clinical data would be needed to make that judgment.
Statistical analysis
ences in donor characteristics. The following donor characteristics were examined for inclusion in the multivariate model: donor type, race, gender, age, Body Mass Index (BMI), collection year, comorbidity status among related donors, pre-donation counts [white blood cell (WBC) count, platelets, neutrophils, mononu- clear cells, hemoglobin], and pre-donation symptoms (skeletal pain or maximum MTC grade). Additional PB donation-specific variables considered were: placement of a central venous line, total blood volume, absolute CD34+ cells and WBC pre-collection, and daily GCSF dose (absolute and per kg).
The effects were estimated via odds ratios (OR). In all multivari- ate models, donor type was forced into the model and stepwise model selection was used to determine additional donor charac- teristics to be included. Interactions between donor type and each donor characteristic were tested for in all multivariate models.
Results
Demographics
Table 1 details RD and URD donating BM or PBSC. RD tended to be older than URD, with 23% versus 6% of BM donors and 49% versus 8% of PBSC donors collected aged between 50-60 years. Although males donated more often in both RD and URD groups, a higher percentage of females donated in the RD group. There was a trend toward higher BMI in RD versus URD giving BM (BMI 30+, 39% versus 29%; P=0.07), and a significant difference in obesity in RD versus URD giving PBSC with 41% versus 28% (BMI 30+; P<0.001).
There are several notable differences between RD and
Analyses were conducted separately for BM and PB donations. Pre-donation baseline variables were compared between RD and URD groups using the Pearson c2 test for categorical variables and the Kruskal-Wallis test for continuous variables.
c2 tests or Fisher’s Exact tests as appropriate were used to com- pare the incidences of skeletal pain and MTC symptoms as well as recovery to pre-donation levels between RD and URD groups. Multivariate analyses using logistic regression models were con- ducted to compare the RD and URD groups accounting for differ-
haematologica | 2019; 104(4)
847
