
Page 201 - 2019_04-Haematologica-web
P. 201
ADMA and post-transplant mortality
(any grade) and grade 3-4 acute GvHD on day +100 after transplantation were 54.0% (95% CI: 50.8%-57.3%) and 13.7% (95% CI: 11.1%-16.3%), respectively. The estimat- ed median follow-up time was 64.9 months (95% CI: 62.0-67.9; range, 0.0-167.7).
Pre-transplant serum asymmetric dimethylarginine levels and their impact on outcome measures after allogeneic stem cell transplantation
Across all 938 patients, the median pre-transplant ADMA level was 0.73 mM [interquartile range (IQR) 0.59- 0.97]. Initial analyses indicated that the proportional haz- ards assumption was violated for pre-transplant ADMA, i.e., the effect of pre-transplant ADMA on mortality risks was not constant over time and was limited to the first year after transplantation or after acute GvHD (additional statistical methods are given in the Online Supplement).
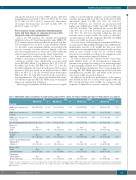
In multivariable analyses adjusted for known con- founders, increasing pre-transplant ADMA levels, as a continuous variable, were significantly associated with worse OS (HR 1.45 per 1- log2 increase, 95% CI: 1.21-1.74, P<0.0001) and shorter PFS (HR 1.30, 95% CI: 1.10-1.54, P=0.002) within the first year after allogeneic SCT, but not thereafter. This was based on an increased risk of NRM (HR 1.43, 95% CI: 1.12-1.83, P=0.005) rather than relapse (HR 1.21, 95% CI: 0.96-1.52, P=0.109) in the year follow- ing transplantation. The results of the multivariable analy- ses with the endpoints OS, PFS, NRM and post-transplant relapse are summarized in Table 2.
Increasing pre-transplant ADMA levels were not signif-
icantly associated with the incidence of acute GvHD (uni- variable: any grade, HR 1.04, 95% CI: 0.90-1.20, P=0.583; univariable: grade 3-4, HR 1.27, 95% CI: 0.93-1.73, P=0.129). However, we observed an association with higher risk of NRM after GvHD onset (HR 1.36, 95% CI: 1.01-1.83, P=0.042). This translated into worse OS (HR 1.46, 95% CI: 1.17-1.83, P=0.001) and shorter PFS (HR 1.32, 95% CI: 1.07-1.63, P=0.010) within the first year after the onset of acute GvHD. The results of the multi- variable analyses with the endpoints OS, PFS, and NRM after acute GvHD are given in Table 3.
The association of increasing pre-transplant ADMA lev- els with shorter OS and PFS and higher risk of NRM in the multivariable models, both within the first year after- transplantation and within the first year after the develop- ment of acute GvHD, could also be observed when patients were stratified according to the transplant center applying a meta-analytic approach (Figure 1).
In order to illustrate the continuous effect of pre-trans- plant ADMA levels on all aforementioned endpoints, patients were grouped according to four increasing ranges of pre-transplant ADMA levels determined by the quar- tiles of the ADMA distribution. The corresponding plots showing OS, PFS, NRM and relapse in the first year after transplantation, and OS, PFS, and NRM in the first year after acute GvHD are given in Figure 2.
In addition, the prediction performance of the univari- able ADMA models was assessed with regards to OS and PFS (overall and after acute GvHD). As compared to the respective Kaplan-Meier survival estimates, the ADMA
Table 2. Multivariable analysis of predictors of overall survival, progression-free survival, non-relapse mortality and relapse (n=938, complete case analysis).
OS PFS NRM* Relapse* HR(95%CI) P HR(95%CI) P HR(95%CI) P HR(95%CI) P
Covariate
ADMA (per 1-log2 increase): 1st year
ADMA (per 1-log2 increase):
2-3 years
ADMA (per 1-log2 increase): after 3 years
1.45 (1.21-1.74)
1.02 (0.74-1.41)
1.03 (0.69-1.55)
<0.0001
0.888
0.878 0.008
0.046
0.298
<0.0001
0.090
0.785
1.30 (1.10-1.54)
1.00 (0.71-1.42)
0.93 (0.58-1.52) 1.01 (1.00-1.02)
Ref
0.83 (0.72-1.04)
Ref
1.06 (0.89-1.26)
Ref
0.74 (0.62-0.90)
Ref
1.19 (0.99-1.44) Ref
1.00 (0.76-1.31)
0.002
0.980
0.781 0.034
0.113
0.507
0.002
0.060
0.972
1.43 (1.12-1.83)
1.18 (0.69-2.04)
0.87 (0.48-1.58) 1.03 (1.01-1.04)
Ref
0.76 (0.58-0.99)
Ref
1.14 (0.87-1.48)
Ref
0.55 (0.42-0.72)
Ref
0.99 (0.75-1.29) Ref
0.87 (0.57-1.36)
0.005
0.543
0.645 <0.0001
0.043
0.346
<0.0001
0.912
0.559
1.21 (0.96-1.52)
0.92 (0.59-1.42)
1.07 (0.47-2.44) 1.00 (0.96-1.01)
Ref
0.96 (0.75-1.23)
Ref
0.99 (0.78-1.25)
Ref
0.98 (0.75-1.28)
Ref
1.43 (1.11-1.86) Ref
1.06 (0.74-1.52)
0.109
0.694
0.877 0.395
0.737
0.937
0.895
0.006
0.749
a competing risks leukocyte antigen;
Age at transplantation (per year)1.01 (1.00-1.02)
Donor sex Female Male
Recipient sex Female Male
Donor-recipient HLA matching Mismatched
Matched
Disease stage† Early Late/intermediate
Conditioning‡ Myeloablative Reduced intensity
Ref
0.82 (0.68-1.00)
Ref
1.10 (0.92-1.32)
Ref
0.67 (0.55-0.81)
Ref
1.18 (0.97-1.43) Ref
0.96 (0.72-1.28)
Number of events: overall survival (OS), n=493; progression-free survival (PFS), n=540; non-relapse mortality (NRM), n=243; relapse, n=297. *Cause-specific hazards from analysis for relapse and NRM. †According to Gratwohl et al.41 ‡According to Bacigalupo et al.42 ADMA: asymmetric dimethylarginine; CI: confidence interval; HLA: human HR: hazard ratio.
haematologica | 2019; 104(4)
829
