
Page 123 - 2019_04-Haematologica-web
P. 123
Targeted CD123 therapy in ALL
Results
Patients’ characteristics
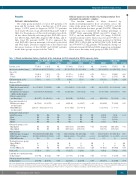
The study group included a total of 213 patients, 131 men and 82 women, with a median age of 40.5 years (range, 1.3-88.3 years) at diagnosis; 25 (11.7%) patients were under 18 years of age (22 with B-ALL and 3 with T- ALL). For the purposes of this study, patients were divid- ed into three clinically relevant groups: BCR-ABL1-posi- tive (Ph+) B-ALL, BCR-ABL1-negative (Ph–) B-ALL, and T- ALL. Most Ph+ patients (42/59; 71.2%) expressed the e1a2 BCR-ABL1 fusion transcript, followed by the b2a2 and b3a2 types. Detailed comparisons of the clinical and laboratory features of the CD123+ and CD123– patients in the three groups are provided in Table 1.
CD123 expression by multicolor/multiparameter flow cytometry in patients’ samples
The median number of blasts detected by multicolor/multiparameter flow cytometry across the entire study group was 76.5% (range, 7.2-98.0%) and did not differ between the three groups (P=0.872). When the entire group was considered, the median percentage of CD45dim blasts expressing CD123 was 64.7% (range, 0.3- 99.9%), and the median RFI was 11.0 (range, 0.0-420.5). CD123 positivity (>20% blasts) was seen in 177 (83%) of all ALL patients. CD123+ blasts were positive for CD34 in 58/59 (98.3%) Ph+ B-ALL, in 95/124 (76.6%) Ph– B-ALL and in 13/30 (43.3%) T-ALL patients. We identified a strong cor- relation between CD123 and CD34 expression on leukemic blasts across the entire study group (r=0.483; P<0.0001).
Table 1. Clinical and laboratory features of patients in the study group (n=213) categorized by CD123 expression status.
B-ALL, BCR-ABL1-positive (n=59)
B-ALL, BCR-ABL1-negative (n=124)
T-ALL (n=30) CD123–
17 (56.7)
30.9 (13.8-58.1)
15 (88.2) 2 (11.8)
5 (29.4) 6
10.9 (1.8-309.2) 11.7 (6.9-16.0)
58 (6-332)
75 (4-94) 1.0 (0-6.0)
1 (5.9) 3 (17.6) 12 (70.6) 1 (5.9)
14/16 (87.5) 2/16 (12.5)
P-value NA
0.802
0.710 NA
0.775
0.224 0.917
0.040 0.093
NA NA NA NA
NA NA
0.933 0.017 0.021
Treatment/response groups
Hyper-CVAD,n
CR/CRp,n 532NA7613NA610NA
Patients, n (%)
Age in years, median (range)
Sex, n (%) Male Female
CNS involvement, n (%)
Allogeneic SCT, n
Peripheral blood parameters Whitebloodcount(x109/L),
median (range) Hemoglobin concentration
(g/dL), median (range) Platelet count (x109/L),
median (range)
Bone marrow parameters BM blast percentage,
median (range) CD123 MFI ratio, median (range)
Immunophenotypic groups* Early T precursor
Early
Thymic
Mature
Cytogenetic groups, n (%) Hypodiploid Hyperdiploid
Flow cytometry
CD45 blast gate, % (range) CD123+ blasts, % (range) CD123 RFI, median
CD123+ CD123–
57 (96.6) 2 (3.4)
54.3 (16.2-80.2)51.2 (37.1-65.3)
CD123+
107 (86.3)
38.1 (1.3-79.9)
61 (57.0) 46 (43.0)
9 (8.4) 15
6.1 (0.2-612.3) 9.3 (4.2-13.8)
42 (4-334)
84 (21-99) 16.9 (0.1-420)
NA NA NA NA
53/99 (53.5) 12/99 (12.1)
CD123–
17 (13.7)
56.0 (10.3-88.3)
10 (58.8) 7 (41.2)
1 (5.9) 1
5.9 (1.0-33.2) 9.4 (6.3-13.2)
38 (13-210)
90 (62-97) 1.1 (0.3-3.4)
NA NA NA NA
11/17 (64.7) 2/17 (11.8)
P-value NA
0.229
0.553 NA
0.589
0.435 0.802
0.802 0.025
NA NA NA NA
0.655
0.307 <0.0001 <0.0001
CD123+
13 (43.3)
28.1 (9.8-65.3)
13 (100) 0 (0)
1/11 (9.1) 6
9.4 (1.0-137.3) 10.7 (7.0-14.9)
44 (13-326)
84 (24-96) 6.3 (1.9-101)
5 (38.5) 7 (53.8) 0 (0) 1 (7.7)
6/11 (54.5) 1/11 (9.1)
P-value NA
1.000
0.313 NA
0.214
0.983 0.615
0.950 0.315
0.001
0.033
0.660 <0.0001 <0.0001
31 (96.9) 26 (96.3)
7 (100)
1 (3.1) 1 (3.7)
0 (0)
20(0.7-381.6) 7(1.8-12.2) 9.7 (7.1-15.8) 10.4 (8.2-12.6)
44 (3-257)
82 (15-98)
22.4 (1.7 – 203.2) 1.25 (1.0-1.5)
NA NA NA NA NA NA NA NA
NA NA NA NA
77.1 (7.2-96.1)73.5 (64.5-82.5) 91.5 (31.6-99.7)13.8 (10.7-16.9)
21.3 1.3
190 (120-260)
69 (66-72)
74.6(11.7-97.4) 84.0(15.3-94.1) 82.4 (20.6-99.9) 7.5 (0.8-19.5) 16.9 1.1
86.3(10.6-98.0) 80.7(17.3-98.0) 66.0 (22.7-93.5) 1.0 (0.3-19.7) 6.3 1.0
Positive MRD, n (%) Dead, n (%)
Leukemia-free survival in months, median (range)
Follow up duration in months,
median (range)
NA 15 (26.3)
16 (0-54)
29 (1-74)
NA 1 (50)
15 (7-22)
22 (8-36)
NA 25/73 (34.2) 0.472 35 (32.7)
0.840 11 (0-53)
0.675 22 (1-99)
3/13 (23.1) 5 (29.4)
20 (3-42)
22 (1-54)
0.328 0.513
0.186
0.876
5/6 (83.3) 6 (46.2)
6 (0-13) 14 (1-50)
4/9 (44.4) 7 (41.2)
10 (2-34) 21 (1-44)
0.168 0.538
0.135 0.304
40 1 NA 49 8 NA 8 8 NA
ALL: acute lymphoblastic leukemia/lymphoma; BM: bone marrow; CNS: central nervous system; MFI: mean fluorescence intensity; RFI: relative fluorescence intensity; Hyper-CVAD: hyperfraction- ated cyclophosphamide, vincristine, doxorubicin and dexamethasone; CR/CRp: clinical remission/without platelet recovery; MRD: minimal residual disease (by flow standardized multiparameter flowcytometryanalysis).NA:not-applicable,SCT:stemcelltransplantation;P-valuesrefertocomparisonsofCD123+ andCD123– patientswithinagivenclinicalsubgroup.
haematologica | 2019; 104(4)
751
