
Page 96 - 2019_02-Haematologica-web
P. 96
L.W. Dillon et al. et al.
ABC
DEF
GH
I
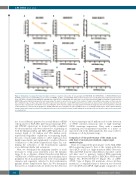
Figure 2. Evaluation of assay performance by target. Cell lines or patient cells positive for assay targets (A) PML-RARA, (B) CBFB-MYH11, (C) RUNX1-RUNX1T1, (D) BCR-ABL1 p210 isoform, (E) BCR-ABL1 p190 isoform, (F) PRAME, (G) WT-1, and (H) NPM1 mutA insertion mutation were serially diluted in peripheral blood mononu- clear cells from a normal healthy individual and RNA was isolated. The resulting RNA was subjected to acute myeloid leukemia (AML) measurable residual disease (MRD) RNA-sequencing library preparation and sequencing. The data are presented as a ratio of the number of target copies/ABL1 copies (log10) on the y-axis and the cell dilution (-log10) on the x-axis. Each data point represents two replicates, except NPM1 mutA (n=1), and error bars represent the standard deviation. A linear regression was calculated for each dilution series (excluding the 100% leukemia samples and any samples for which the target was not detected) and the coefficient of determination (r2) indicated in the graph area. NPM1 mutA data were normalized to either (H) ABL1 copies or (I) wild-type NPM1 copies, both of which exhibited similar results and a strong correlation. If background values were detected in the normal healthy individual, an average of the two libraries sequenced is represented as a dashed line.
rics. A set of libraries generated on a serial dilution of K562 cells (positive for BCR-ABL1 p210 fusion transcript, WT1, and PRAME expression) in normal healthy peripheral blood mononuclear cells were subjected to sequencing on both the Illumina MiSeq and HiSeq 2500 platforms at an average depth of 3.6 million and 38.6 million reads, respectively. Regardless of platform or sequencing depth, the ratio of each target relative to ABL1 expression was highly reproducible and significantly correlated (Pearson correlation r = 1.00) (Online Supplementary Figure S3), con- firming the robustness of the bioinformatics pipeline across different depths and sequencers.
Next, we determined the minimum number of reads necessary to retain assay sensitivity across the dynamic range. To do so, libraries obtained from the serial dilution of K562 cells or NPM1 mutA patient cells in healthy donor peripheral blood mononuclear cells were down-sampled stepwise and separately subjected to the bioinformatics pipeline (Online Supplementary Figure S4). We determined that as few as 1 million reads are needed for the detection
of fusion transcripts and 3 million reads for the detection of NPM1 insertion mutations (due to high wild-type NPM1 transcript expression). Thus, with a minimal sequencing read requirement equivalent to a micro or nano flow cell on the MiSeq platform, this assay is able to retain up to a 5-log dynamic range.
Comparison of the performance of the study assay with that of current gold-standard, single-target methodologies
Next, we compared the performance of the AML MRD RNA-sequencing panel to that of the current gold-stan- dard qPCR assays for single-mutation MRD detection. The same RNA from the serial dilution of positive control cell lines used to generate targeted RNA-sequencing libraries was assessed by qPCR or ddPCR for NPM1 mutA (Figure 3A), RUNX1-RUNX1T1 (Figure 3B), or CBFB- MYH11 type A (Figure 3C) mutations. Across all three mutations, a comparable limit of detection was observed for both qPCR and ddPCR (right graph) compared to tar-
300
haematologica | 2019; 104(2)
