
Page 54 - 2019_02-Haematologica-web
P. 54
A. Contejean et al.
Table 1. Population characteristics at diagnosis (n=88).
n(%) or median [IQR] (min-max)
Male
Age (years)
Weight (kg)
Charlson comorbidity index Performance status
Blood count
PMN (x109/L) Lymphocytes (x109/L) Hemoglobin (g/dL) MCV (fL) Reticulocytes (x109/L) Platelets (x109/L)
AA severity Mild
Severe
Very severe
Myelogram cellularity
Markedly increased Increased
Average
Reduced
Poor
45 (51%)
68.5 [63.75;74] (60-89) 69 [61;80] (45-110) 2 [1;2.25] (0-6)
1 [0;1] (0-3)
0.705 [0.335;1.2] (0-7.4) 1.3 [0.979;1.792] (0.031-3.94) 8.25 [6.98;9.2] (3-13.6) 95 [89;101] (80-115) 23.5 [13;42] (0-90)
10.5 [5;19.8] (1-82)
38 (43%) 32 (36%) 18 (21%)
1 (1%)
2 (2%)
18 (21%)
44 (50%)
17 (19%)
6 (7%)
7 (9%)
88 (100%)
6 (8%)
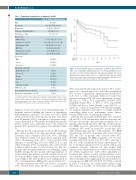
Figure 1. Overall survival. Causes of death were as follows: nine infections (38%), four hemorrhagic complications (17%), five deaths in palliative care or after active treatment had finished (21%), two cases involving unknown etiolo- gies (8%), one case of clonal evolution to acute myeloid leukemia, one case of multi-metastatic breast cancer, one case of hypercalcemia, and one cardiac arrest. The survival curve (solid line) was obtained using the Kaplan Meier esti- mator. Dashed lines represent confidence intervals (CI95%).
ATG, CsA and eltrombopag), CsA alone for 20%, andro- gens for 9%, eltrombopag for 3%, and other treatments in 18% of cases. Comparisons of patients treated with ATG- CsA, CsA or other treatments (Table 2) revealed that patients receiving ATG-CsA were significantly younger (66 years, vs. 71.5 vs. 71.5, respectively, P=0.007), more frequently female (61%, vs. 50% vs. 27%, respectively, P=0.02) and had a lower platelet count (8x10⁹/L, vs. 12x109/L vs. 15x109/L, respectively, P=0.025). Interestingly, we found no difference with respect to weight, Charlson comorbidity index score, performance status, disease severity, PNH clones, or myelogram cellularity.
After the 181 assessable treatment lines, 19% achieved CR and 19% a PR. Median time until best response was 151 days (4.9 months). After first-line treatment, 32% of patients achieved CR and 15% a PR. The overall response rate (ORR) was 62% with ATG-CsA (70% as a first-line treatment), 35% with CsA alone (39% as first line), 22% with eltrombopag, and 21% with androgen. The ORR after first line was 69% in patients who received horse ATG and 75% in patients who received rabbit ATG (P=0.40). Strikingly, the ORR in patients over 70 years receiving ATG-CsA (n=16) was 81% (50% achieving a CR, 31% a PR). Treatment line and poor performance sta- tus at treatment initiation were associated with poorer treatment responses, whereas sex, age, weight, high Charlson comorbidity index score or disease severity were not (Online Supplementary Table). After adjustment for treatment line, disease severity and performance status, we found that, when compared with all other treatments, ATG-CsA regimen was significantly associated with a bet- ter response rate (OR 4.18 (1.93;9.09), P=0.0003) as shown in Table 3. Moreover, in a multivariable analysis using ATG-CsA as a baseline, we found that CsA alone (OR
Unknown or failure
PNH clone ≥ 5%
Bone marrow biopsy performed
Cytogenetic abnormalities& (n=78)
&Cytogenetic analysis was performed in 80 patients, showing normal results in 80% of cases and failure in 11%. Six patients had cytogenetic abnormalities: 2 delY, 1 del13p, 1 del4q, 1 split of IgH locus and 1 tri8. For one patient, the result was unknown. IQR: Inter-Quartile Range; MCV: Mean Corpuscular Volume; PMN: Polymorphonuclear Neutrophils; PNH: Paroxysmal Nocturnal Hemoglobinuria.
diagnosis. In 17 cases (21%), we found minimal signs of dysplasia without fulfilling the criteria for hypoplastic myelodysplastic syndrome.9 In seven cases (9%), PNH clones were above 5%. Bone marrow biopsies were taken from 88 patients (100%) at diagnosis. Cytogenetic analy- sis was performed for 78 patients, showing normal results in 80% of these cases, and failure in 11%. Six of these 78 patients (8%) presented cytogenetic abnormalities (Table 1).
Overall, the 88 study patients received 184 treatment lines, with a median of two lines per patient (range 1-5). Treatment lines comprised ATG-CsA (33%, including 72% with horse ATG), CsA alone (14%), androgen alone (14%), eltrombopag alone (10%), CsA associated with androgen or eltrombopag (9%), two AHSCTs (1%), and other treatments (19%). For patients who received CsA, median residual dosing of CsA between one and two months after treatment initiation was 200ng/mL (range 42-560). During the first month following initiation of each treatment line, patients received a median of four red blood packs (RBPs) (range 0-26) and four platelet transfu- sions (range 0-18). Iron chelators were administered in 19% of treatment lines, EPO in 21%, and G-CSF in 23%.
First-line treatment was ATG-CsA for 50% of patients (73% received horse ATG, and 11% a combination of
258
haematologica | 2019; 104(2)
