
Page 205 - 2019_02-Haematologica-web
P. 205
Anti-HLA antibodies with complementary and synergistic interaction
(SN230G6) and anti-HLA-A11 (BRO11F6) (Figure 2B), anti-HLA-A11 (BRO11F6) and anti-HLA-B52 (OK8F11), or anti-HLA-B44 (DK7C11) and anti-HLA-B62 (OK8F11) induced C3b deposition on platelets. Only when incubat- ed together, the two anti-HLA-A2 antibodies SN607D8 and SN230G6, which bind to opposite sides of the peptide binding groove in HLA-A2,20,21 were very effective in inducing complement activation. Even at concentrations as low as 0.2 μg/ml, these antibodies induced C3b deposi- tion (Figure 2D). The levels of complement activation are
however dependent on the donor. Together, these results suggest that the geometry of binding of anti-HLA antibod- ies determines whether or not complement deposition can occur.
Complement deposition induced by anti-HLA antibodies occurs via the classical pathway
Both classical- and alternative complement pathway activation have been described to occur on platelets.9,11,22 To discriminate between these pathways, platelets were
AB
CDE
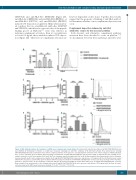
FGH
Figure 5. HLA antibodies induce the formation of a MAC, pore formation and calcium influx. (A) Complement activation was induced by SN607D8/SN230G6 and was inhibited by Eculizumab. Formation of a MAC was measured employing an anti-C5b-9 antibody. (n=4) (B) Representative flow cytometry plot showing SN607D8/SN230G6 induced formation of the C5b-9 complex (solid line). In the presence of Eculizumab the formation of the C5b-9 complex is inhibited (dashed line). (C) Pore formation upon incubation with increasing concentrations of SN607D8 and SN230G6 was measured using an impermeable dye, binding to free amines: referred to as live/dead marker (L/D). (n=4) (D) Pore formation was blocked with anti-C1q. (n=4) (E) Representative flow cytometry plot of pore formation measured by L/D marker upon complement activation by 10 mg/ml SN607D8/SN230G6 in presence and absence of 50 mg/ml anti-C1q. (F) Platelets were loaded with fluo-4 to measure a calcium influx upon incubation with increasing concentrations of SN607D8 and SN230G6. On the y-axis, the percentage of Fluo-4 positive platelets is depicted (n=4). (G) Pre-incubation of platelets with 50 mg/ml anti-C1q inhibited calcium influx induced by 10 mg/ml SN607D8/SN230G6. (n=4) (H) Representative flow cytometry plot of fluo-4 signal induced by 10 mg/ml SN607D8/SN230G6 in the presence and absence of 50 mg/ml anti-C1q. Data are repre- sented as mean ± SD. MFI: mean fluoresence intensity, *P<0.05; **P<0.01; ***P<0.005.
haematologica | 2019; 104(2)
409
