
Page 201 - 2019_02-Haematologica-web
P. 201
Anti-HLA antibodies with complementary and synergistic interaction
Calcium influx
Platelets were loaded with calcein violet and fluo-4 for 30 min at RT, washed and resuspended in platelet assay buffer. Complement activation assay was initiated as described above. After 20 min incubation at 37°C, platelets were diluted in assay buffer and calcium influx was measured immediately using flow cytometry by measuring fluo-4 signal. Platelets were gated upon their calcein violet fluorescence.
AB
CD
Data and statistical analysis
Flow cytometry data was analyzed using FlowJo version 10 (Ashland, OR, USA). Data are represented as either mean ± stan- dard deviation (SD) or all data points are shown. Statistical analy- ses were performed using GraphPad Prism 7 Version 7.02 (La Jolla, CA, USA); the analyses used are specified in the respective figure legends.
E
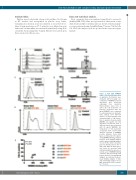
Figure 1. HLA mAb WIM8E5 induces C3b and C4b deposition on platelets. (A) Platelets were incubated with increasing con- centrations of WIM8E5 and C3b deposition was measured employing flow cytometry. Representative data from 1 donor. (B) C3b deposition on platelets incubated with 20 mg/ml WIM8E5 were compared to control platelets (no HLA anti- body added). (n=7 different donors). (C) Representative flow cytometry graph of C4b deposi- tion on platelets incubated with WIM8E5 (20 mg/ml). (D) C4b deposition on platelets from 7 different donors upon incubation with 20 mg/ml WIM8E5. (E) Comparison of C3b deposition on platelets from 3 donors with different amounts of WIM8E5 reactive antigens. Donor HLA types are indicated in the figure, strong WIM8E5 binding antigens in green, weak binding antigens in blue and non-binding antigens in red. (F) Five donors heterozy- gous for HLA-A2 (and no A3 or A32) with different HLA expres- sion levels (as measured with anti-human IgG in the absence of serum). Level of WIM8E5 binding correlates with percentage C3b positive platelets. Strong binding antigens are indicated in green, weak binding antigens in blue and non-binding antigens in red. MFI: mean fluorescence intensi- ty. **P<0.01.
F
2
R 0.979
P <0.005
haematologica | 2019; 104(2)
405
