
Page 163 - 2019_02-Haematologica-web
P. 163
Refining prognosis in early-stage CLL
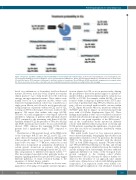
Figure 7. Prognostic algorithm regarding treatment probability for chronic lymphocytic leukemia (CLL). 5y-TP: treatment probability five years from diagnosis; 10y- TP: treatment probability ten years from diagnosis; U-CLL: CLL with unmutated IGHV genes; M-CLL: CLL with mutated IGHV genes; TP53abn: deletion of chromosome 17p (del(17p)) and/or TP53 mutation; +12:trisomy 12, del(11q): deletion of chromosome 11q; SF3B1mut: SF3B1 mutation; #2: assignment to stereotyped subset #2. The pie chart refers to the entire cohort with each slice indicating the proportion of patients according to Binet clinical staging.
based on combinations of biomarkers and host-derived features. However, none has been adopted in everyday clinical practice,13 e.g. to help decide about the follow-up strategy amongst untreated patients. These indices were mainly based on Cox regression models, where each respective training/validation cohort was considered as a single group. Herein, we followed a novel approach eval- uating prognosis separately within M-CLL and U-CLL focusing on TTFT in the largest ever series studied to this purpose. We report that within early stage M-CLL, TP53abn, +12 and assignment to stereotyped subset #2 identified a subgroup of patients with uniformly shorter TTFT compared to the remaining early Binet A M-CLL. Similarly, within U-CLL the presence of TP53abn, del(11q) and SF3B1 mutations was found to be associated with the shortest TTFT, whereas the remaining U-CLL female patients had a significantly longer TTFT compared to males.
Classification of CLL patients based on the SHM status of the clonotypic BcR IG into M-CLL and U-CLL cate- gories offers robust prognostic information, differing from other prognostic markers (e.g. genetic aberrations) that may evolve over time.15,17,18,43 Of note, studies by us and others have documented an asymmetric distribution of certain genetic aberrations in patients with distinct immunogenetic features extending from the M-CLL or U- CLL categorization to different stereotyped subsets.32,44,45 This has prompted speculation that particular modes of immune signaling initiated by specific BcR IG may trigger different pathways of clonal evolution leading to the emergence of distinct disease variants.
For these reasons, the BcR IG appears an obvious start- ing point for developing a biologically-orientated prognos-
tication scheme for CLL, as in our present study, offering the possibility to dissect the precise impact of a given bio- marker within a particular immunogenetic category (e.g. M-CLL or U-CLL). For example, within M-CLL, +12 was found to define a subgroup of patients with a TTFT simi- lar to that of patients harboring TP53abn, whereas, in con- trast, +12 was associated with favorable outcome within U-CLL (Figure 6A and B). Of note, mutations within the NOTCH1 gene had no impact on survival among U-CLL cases with +12 (Online Supplementary Figure S6). These findings may explain: i) why +12 is considered as an inter- mediate-risk aberration in prognostic indices where CLL is evaluated as one group regardless of the SHM status;38 and, ii) the contradictory results reported in different cohorts with different relative proportion of M-CLL and U-CLL patients, regarding the significance of a given indi- cator that can show an asymmetric distribution within each SHM group.
Our initial results based on Cox regression analysis were validated internally, being highly reproducible in an independent validation cohort. In particular, the median TTFT for the subgroups of patients with the shortest TTFT in both SHM categories, namely TP53abn/+12/#2 and TP53abn/SF3B1mut/del(11q) for M-CLL and U-CLL respectively, was almost identical between the validation and the training cohort. Interestingly, the latter exhibited significant differences in terms of the biological back- ground compared to the training cohort (Online Supplementary Table S2); this may be taken as further evi- dence for the robustness of our approach, since similar results were obtained across cohorts with differing patient composition. Cox regression results were further con- firmed through the application of an alternative statistical
haematologica | 2019; 104(2)
367
