
Page 159 - 2019_02-Haematologica-web
P. 159
Refining prognosis in early-stage CLL
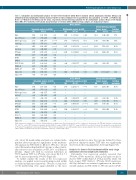
Table 1. Univariable and multivariable analysis for time-to-first-treatment within Binet A mutated chronic lymphocytic leukemia (M-CLL) and unmutated chronic lymphocytic leukemia (U-CLL). Harrell’s C-index (standard error in parenthesis) was calculated as 0.745 (se=0.013) and 0.753 (se=0.013) for the M-CLL and the U-CLL, respectively. Internal bootstrap validation for the multivariable analysis. Means of the Hazard Ratio (HR), 95% Confidence Interval (CI) and percentage of selection within 1000 bootstrap samples are displayed per factor.
M-CLL/Binet A
Multivariable analysis (n=918)
HR
Internal bootstrap validation
Male
Age >65 years CD38 expression idel(13q)
+12
del(11q)
TP53abn NOTCH1 SF3B1 MYD88 GI:97-97.99% IGHV3-23 IGHV3-21* Subset #2 Subset #4
Male
Age >65 years CD38 expression del13q**
+12
del(11q)
TP53abn NOTCH1 SF3B1 BIRC3 GI:100% IGHV1-69 Subset #1
1.352 1.063-1.718
0.976 0.769-2.237 2.017 1.474-2.760 0.761 0.573-1.010 2.428 1.691-3.487 2.010 0.944-4.281 3.347 2.175-5.151 2.107 0.993-4.447 1.856 0.913-3.771 1.551 0.680-3.538 1.571 1.069-2.308 1.025 0.719-1.461 1.466 0.605-3.555 3.384 1.594-7.181 0.658 0.309-1.398
P
0.013
0.842
<0.0001
0.059
<0.0001
0.071
<0.0001
0.052
0.088
0.296
0.021
0.89
0.396
0.001
0.277
U-CLL/Binet A
1.354
95% CI P 1.007-1.820 0.044
1.406 1.044-1.894 57%
1.048 0.666-1.648 8.4%
Univariable analysis (n=1224) HR 95% CI
Factors (mean) HR 95% CI
Selection percentage
-
--
1.058
0.678-1.652 0.801
-
--
2.565
1.665-3.952 <0.0001
2.669 1.769-4.031 3.064 1.864-5.047
98.2% 95.6%
-
--
2.685
1.607-4.485 0.0001
- - - 0.988 -
-- -- --
0.568-1.717 0.966
0.940 0.529-1.679 3.4%
3.885 1.353-12.267 62%
Internal bootstrap validation
-
--
--
3.268
1.155-9.244 0.025
-
--
Univariable analysis (n=672) HR 95% CI
U-CLL/Binet A
Multivariable analysis (n=384)
Factors (mean) HR 95% CI
1.630 1.239-2.146
0.912 0.640-1.299 1.475 1.098-1.983 1.475 1.098-1.983
1.682 1.159-2.442
Selection percentage
93.8%
10.4% 69.1% 69.1%
73.4%
1.341 1.106-1.626
0.845 0.701-1-020
1.144 0.832-1.575
0.902 0.729-1.117
0.751 0.568-0.993
1.640 1.292-2.082
1.613 1.213-2.146
1.142 0.874-1.493
1.892 1.335-2.682
1.206 0.532-2.732
1.231 0.993-1.524
1.190 0.959-1.457
1.382 0.939-2.033
1.610
P
0.028
0.079
0.405
0.347
0.045
<0.0001
0.001
0.328
<0.0001
HR
95% CI P 1.229-2.109 0.0005
- - - 0.898 1.432 2.357 - 1.624 -
-- -- --
0.632-1.274 1.071-1.916 1.548-3.589
0.547 0.0151 <0.0001
--
0.652
--
0.056 - - v
1.129-2.337 0.008
0.112 - - -
0.099 - - -
CD38 expression: positivity >30%; idel(13q): isolated deletion of chromosome 13q; +12: trisomy 12; del(11q): deletion of chromosome 11q; TP53abn: deletion of chromosome 17p (del(17p)) and/or TP53 mutation; GI: germline identity; IGHV3-23: usage of IGHV3-23; IGHV3-21*: usage of IGHV3-21 non subset #2; subset #2: assignment to stereotyped sub- set #2; subset #4: assignment to stereotyped subset #4. **Due to the low number of cases with available data for all abnormalities detected by fluorescence in situ hybridization (FISH), deletion of chromosome 13q was used instead of idel(13q) for the U-CLL cohort.
+12, subset #2 membership and male sex retained inde- pendent adverse prognostic significance in the multivari- able analysis (n=918) (Table 1). Of note, TP53abn, +12 and subset #2 membership identified 3 groups of almost mutu- ally exclusive cases (altogether: n=153, 16% of all Binet A M-CLL) (Figure 2A) with no statistical differences in TTFT (median TTFT for TP53abn, +12, subset #2: 5.4, 7.1 and 4.1 years respectively; P=0.19) (Figure 2B).
To further validate the results of the Cox regression analysis, we applied recursive partitioning models within a conditional inference framework. TP53abn, +12 and sub- set #2 membership were again identified as the most
important predictors since the 3 groups defined by these predictors displayed similar TTFT that was significantly shorter from the remaining Binet A M-CLL (Figure 3A).
Analysis for time-to-first-treatment within early stage unmutated chronic lymphocytic leukemia
Univariable Cox regression analysis revealed that TP53abn, SF3B1 mutations, del(11q) and male sex had a shorter TTFT within Binet-A U-CLL (n=676), while +12 had a longer TTFT (Table 1). TP53abn, SF3B1 mutations, del(11q) and male sex retained significance in the multi- variable analysis (n=384) (Table 1). TP53abn and/or SF3B1
haematologica | 2019; 104(2)
363
